R语言因子排序
画图的时候,排序是个很重要的技巧,比如有时候会看下基因组每条染色体上的SNP的标记数量,这个时候直接做条形图是一种比较直观的方法,下面我们结合实际例子来看下:
在R环境下之际构建一个数据框,一列染色体名称,一列统计数据。
  1 chr<-paste("chr",c(1:18,"X","Y"),sep="")
  2 set.seed(2)
  3 num<-runif(20,100,5000)
  4 df<-data.frame(chr=chr,num=num)
  5 df
内容如下:
一、barplot()
我们直接用基础绘图函数barplot()画图,染色体顺序是不会变化的:
1 barplot(t(as.matrix(df$num)),col="cyan",border = NA,names.arg = df$chr)
二、ggplot2
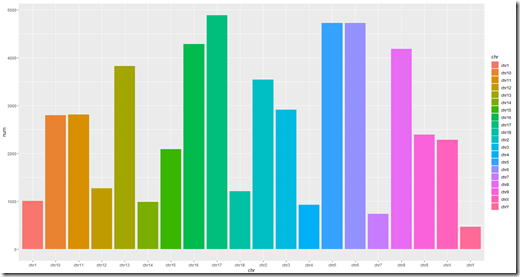
如果用ggplot2画图,染色体顺序就不是我们想要的了:
  1 library(ggplot2)
  2 ggplot(df,aes(y=num,x=chr,fill=chr))+geom_bar(stat = 'identity')

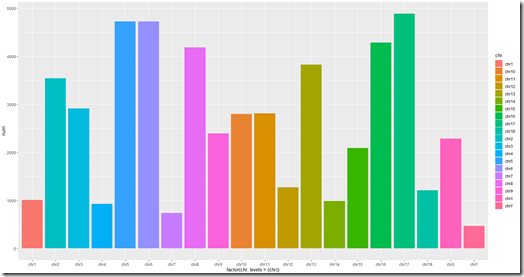
我们可以利用factor进行因子排序,将顺序调整成我们需要的样子:
  1 ggplot(df,aes(y=num,x=factor(chr,levels=(chr)),fill=chr))+
  2   geom_bar(stat = 'identity')

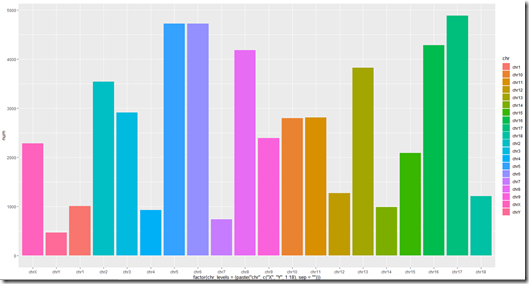
或者其他形式,这里我把X,Y染色体提前:
  1 ggplot(df,aes(y=num,fill=chr,
  2               x=factor(chr,levels=(paste("chr",c("X","Y",1:18),sep="")))))+
  3   geom_bar(stat = 'identity')

后续继续做其他调整,如图例顺序调整。
作者:天使不设防
本文版权归作者和博客园共有,欢迎转载,但未经作者同意必须保留此段声明,且在文章页面明显位置给出原文连接,否则保留追究法律责任的权利.


【推荐】编程新体验,更懂你的AI,立即体验豆包MarsCode编程助手
【推荐】凌霞软件回馈社区,博客园 & 1Panel & Halo 联合会员上线
【推荐】抖音旗下AI助手豆包,你的智能百科全书,全免费不限次数
【推荐】博客园社区专享云产品让利特惠,阿里云新客6.5折上折
【推荐】轻量又高性能的 SSH 工具 IShell:AI 加持,快人一步
· 浏览器原生「磁吸」效果!Anchor Positioning 锚点定位神器解析
· 没有源码,如何修改代码逻辑?
· 一个奇形怪状的面试题:Bean中的CHM要不要加volatile?
· [.NET]调用本地 Deepseek 模型
· 一个费力不讨好的项目,让我损失了近一半的绩效!
· 微软正式发布.NET 10 Preview 1:开启下一代开发框架新篇章
· 没有源码,如何修改代码逻辑?
· PowerShell开发游戏 · 打蜜蜂
· 在鹅厂做java开发是什么体验
· WPF到Web的无缝过渡:英雄联盟客户端的OpenSilver迁移实战