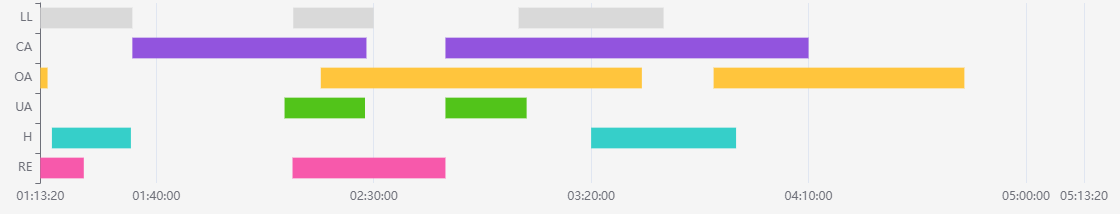
空白的实现只能通过计算两个有值的柱图的差值作为该空白柱图的值,然后设置该柱图的颜色为透明,实现空白效果// 声明一个返回结构体的函数,不能是类,不然放到series里不对
const Blank = function (datas) { // 返回空白结构体
return {
name: 'Placeholder',
type: 'bar',
stack: 'Total',
itemStyle: { borderColor: 'transparent', color: 'transparent' }, // 设置颜色为transparent实现空白效果
emphasis: { itemStyle: { borderColor: 'transparent', color: 'transparent' } },
data: datas
}
}
const RangeBlock = function (datas) { // 有值的柱图结构体
return {
name: '总时长',
type: 'bar',
stack: 'Total',
data: datas.map((item, index) => {
return { value: item }
})
}
}
数据的样子大概是:testData: [
[[2000, 5000], [7880, 9990]],
[[3330, 3550], [4560, 5650], [12000, 14000]],
[[7770, 8880], [9990, 11110]],
[[230, 450], [780, 2990], [3460, 7890], [8880, 12340]],
[[2220, 3330], [5670, 8900], [9990, 15000]],
[[3450, 5670], [7890, 9000], [11000, 13000]]
]
然后再Vue中定义method处理数据为seriesbarDataHandler (data) {
const res = []
// 先获取区间最多的一个项的区间数量
let max = 0
data.map(item => {
max = item.length > max ? item.length : max
})
for (let i = 0; i < max; i++) {
const tempBlank = []
const tempBlock = []
data.map(item => {
if (item.length > i) {
tempBlank.push(i > 0 ? item[i][0] - item[i - 1][1] : item[i][0])
tempBlock.push(item[i][1] - item[i][0])
} else {
tempBlank.push(0)
tempBlock.push(0)
}
})
res.push(Blank(tempBlank)) // 先放空白
res.push(RangeBlock(tempBlock)) // 再放有数据的
}
return res
}
然后把处理好的series放到option里即可