Prometheus设置systemctl管理
Prometheus可以设置成后台启动 参考:https://www.cnblogs.com/minseo/p/13370596.html
但是其他应用程序大多使用systemctl管理启动,为统一设置Prometheus为systemctl启动
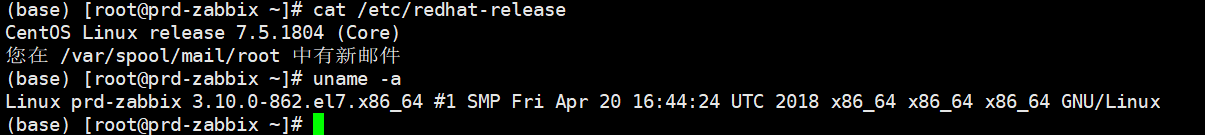
环境查看
下载prometheus
下载地址:https://github.com/prometheus/prometheus/releases
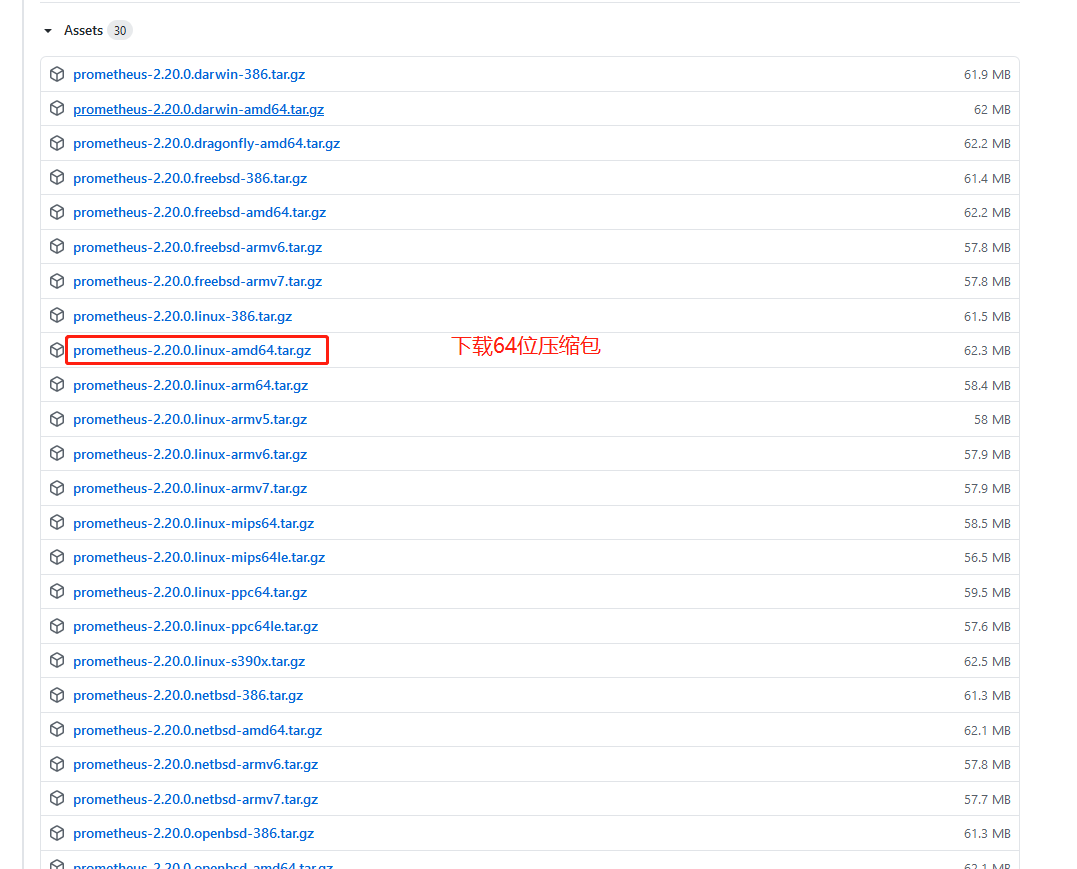
解压
#解压
tar -xf prometheus-2.20.0.linux-amd64.tar.gz
#设置软连接
ln -s /usr/local/prometheus-2.20.0.linux-amd64 /usr/local/prometheus
#拷贝配置文件至/etc
cd promrtheus
cp prometheus.yml /etc/
prometheus默认配置文件
# cat /etc/prometheus.yml
# my global config
global:
  scrape_interval:     15s # Set the scrape interval to every 15 seconds. Default is every 1 minute.
  evaluation_interval: 15s # Evaluate rules every 15 seconds. The default is every 1 minute.
  # scrape_timeout is set to the global default (10s).

# Alertmanager configuration
alerting:
  alertmanagers:
  - static_configs:
    - targets:
      # - alertmanager:9093

# Load rules once and periodically evaluate them according to the global 'evaluation_interval'.
rule_files:
  # - "first_rules.yml"
  # - "second_rules.yml"

# A scrape configuration containing exactly one endpoint to scrape:
# Here it's Prometheus itself.
scrape_configs:
  # The job name is added as a label `job=<job_name>` to any timeseries scraped from this config.
  - job_name: 'prometheus'

    # metrics_path defaults to '/metrics'
    # scheme defaults to 'http'.

    static_configs:
    - targets: ['localhost:9090']
设置systemctl管理
# cat /usr/lib/systemd/system/prometheus.service
[Unit]
Description=Prometheus Node Exporter
After=network.target

[Service]
ExecStart=/usr/local/prometheus/prometheus --config.file=/etc/prometheus.yml --web.read-timeout=5m  --web.max-connections=10 --storage.tsdb.retention=15d --storage.tsdb.path=/prometheus/data --query.max-concurrency=20 --query.timeout=2m
User=root
[Install]
WantedBy=multi-user.target
启动参数解释
–config.file=/etc/prometheus.yml 指定配置文件

–web.read-timeout=5m 请求链接的最大等待时间,防止太多的空闲链接占用资源

–web.max-connections=512 针对prometheus,获取数据源的时候,建立的网络链接数,做一个最大数字的限制,防止链接数过多造成资源过大的消耗

–storage.tsdb.retention=15d 重要参数,prometheus 开始采集监控数据后,会存在内存和硬盘中;对于保存期限的设置。时间过长,硬盘和内存都吃不消;时间太短,要查历史数据就没了。企业15天最为合适。

–storage.tsdb.path="/prometheus/data" 存储数据路径,不要随便定义

–query.max-concurrency=20 用户查询最大并发数

–query.timeout=2m 慢查询强制终止
注意:配置文件不能加双引号,否则启动报错找不到文件或目录
本次启动用户是root生产中最好新建一个用户用于启动,需要设置配置文件及数据文件权限
数据目录在生产中最好单独配置数据硬盘,使用LVM硬盘格式配置
启动
#启动
systemctl start prometheus
#设置开机自启动
systemctl enable prometheus
查看是否启动
lsof -i:9090
ps -ef|grep prometheus

web页面查看

设置systemctl管理完成

 浙公网安备 33010602011771号