ELK之使用filebeat收集系统数据及其他程序并生成可视化图表
当您要面对成百上千、甚至成千上万的服务器、虚拟机和容器生成的日志时,请告别 SSH 吧。Filebeat 将为您提供一种轻量型方法,用于转发和汇总日志与文件,让简单的事情不再繁杂。
1,安装filebeat
rpm -ivh /nas/nas/softs/elk/6.5.4/filebeat-6.5.4-x86_64.rpm
查看模块
[root@prd-elk-kafka-01 ~]# filebeat modules list
Enabled:
kafka
system

Disabled:
apache2
auditd
elasticsearch
haproxy
icinga
iis
kibana
logstash
mongodb
mysql
nginx
osquery
postgresql
redis
suricata
traefik
如需要启用某个模块使用命令
filebeat modules enable system
修改配置文件把filebeat输出至elasticsearch和kibana
/etc/filebeat/filebeat.yml
filebeat.config.modules:
  path: ${path.config}/modules.d/*.yml
  reload.enabled: false
setup.template.settings:
  index.number_of_shards: 3
output.elasticsearch:
  hosts: ["172.16.90.24:9200"]
#  username: "admin"
#  password: "admin"
setup.kibana:
  host: "172.16.90.24:5601"
processors:
  - add_host_metadata:
  - add_cloud_metadata:
#  - drop_fields:
#      fields: ["beat", "input", "source", "offset", "prospector","host"]
模块路径为/etc/filebeat/modules.d/
2,设置系统模块system
启用系统模块
/etc/filebeat/filebeat.yml
编辑系统模块配置文件,这里使用默认
/etc/filebeat/modules.d/system.yml
- module: system
  # Syslog
  syslog:
    enabled: true

    # Set custom paths for the log files. If left empty,
    # Filebeat will choose the paths depending on your OS.
    #var.paths:

    # Convert the timestamp to UTC. Requires Elasticsearch >= 6.1.
    #var.convert_timezone: false

  # Authorization logs
  auth:
    enabled: true

    # Set custom paths for the log files. If left empty,
    # Filebeat will choose the paths depending on your OS.
    #var.paths:

    # Convert the timestamp to UTC. Requires Elasticsearch >= 6.1.
    #var.convert_timezone: false
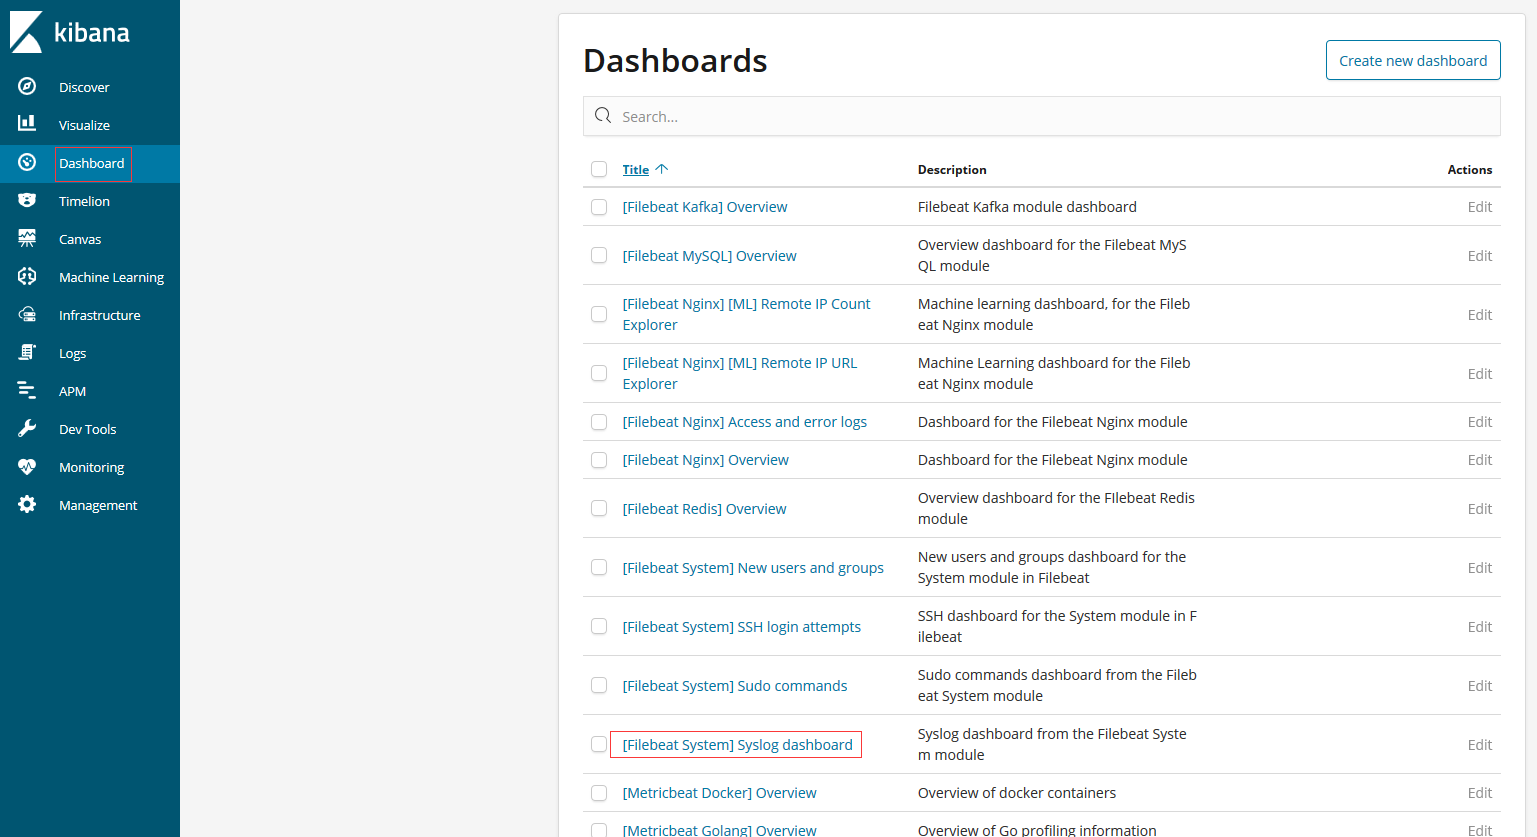
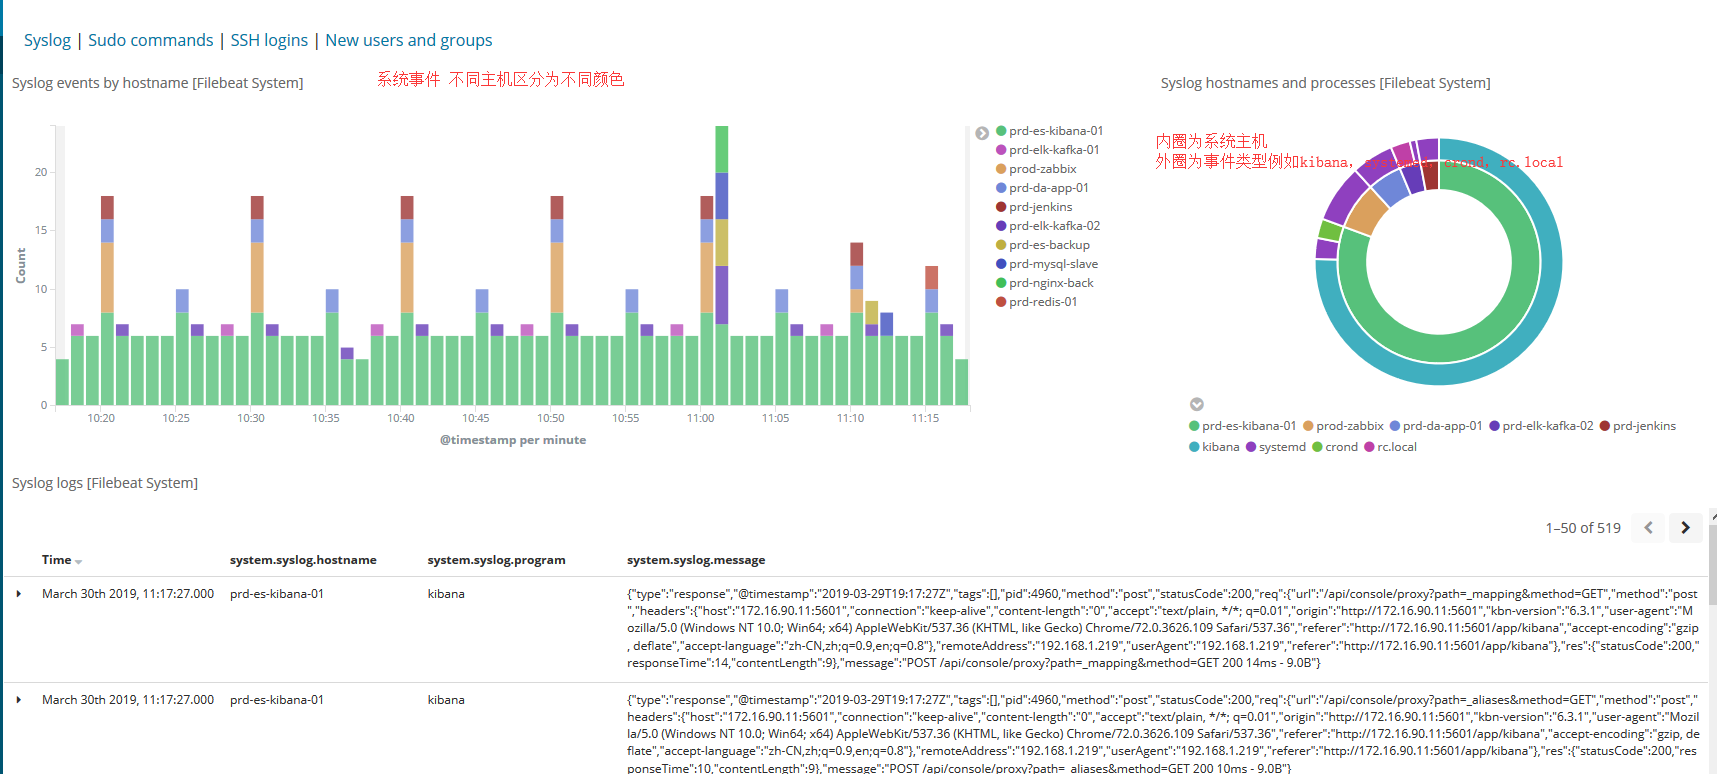
系统模块每一台主机都需要安装,启用后查看kibana
3,设置nginx模块
启动nginx模块
filebeat modules enable nginx
修改配置文档
/etc/filebeat/modules.d/nginx.yml
输入access日志及error日志路径
- module: nginx
  # Access logs
  access:
    enabled: true

    # Set custom paths for the log files. If left empty,
    # Filebeat will choose the paths depending on your OS.
    var.paths:
      - "/opt/log/wwwaccess.log"
      - "/opt/log/workaccess.log"
      - "/opt/log/datavaccess.log"

  # Error logs
  error:
    enabled: true


    # Set custom paths for the log files. If left empty,
    # Filebeat will choose the paths depending on your OS.
    var.paths:
      - "/opt/log/wwwerror.log"
      - "/opt/log/workerror.log"
      - "/opt/log/dataverror.log"
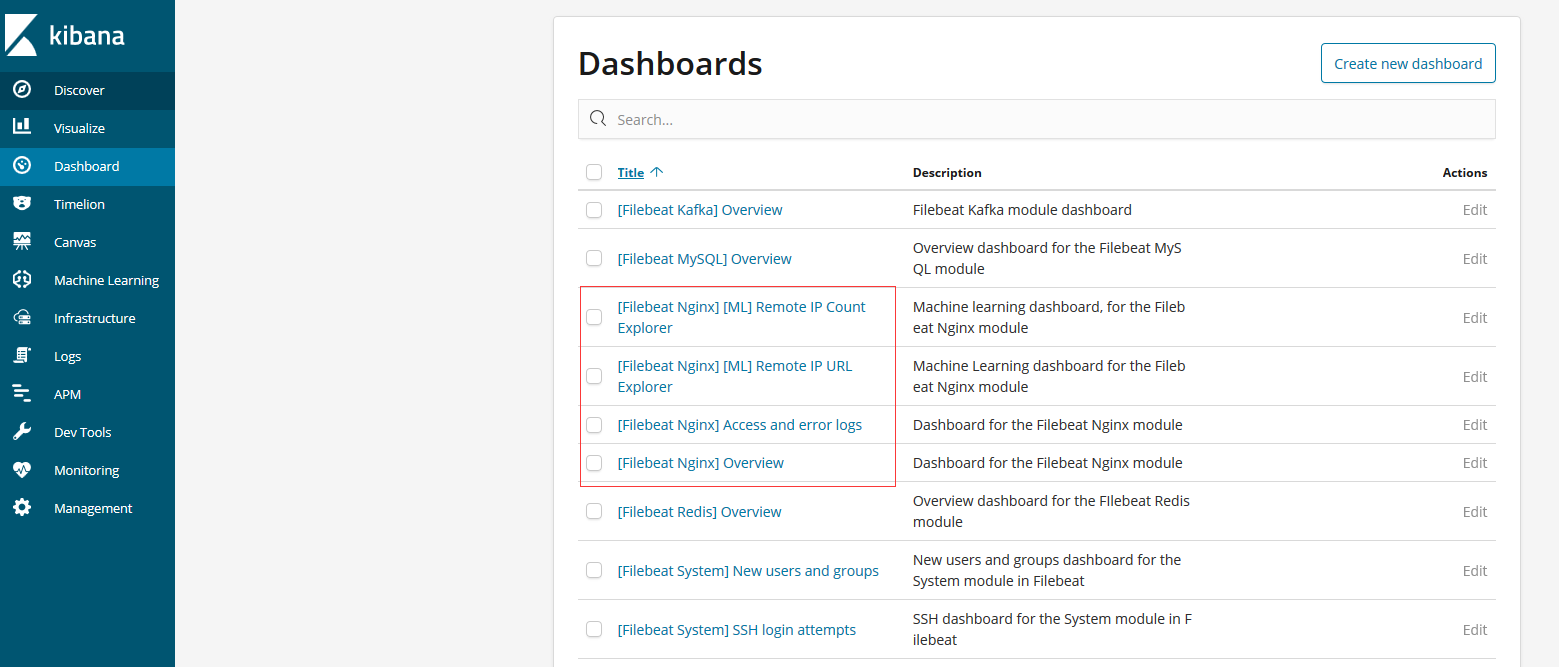
kibana查看


要显示客户端城市及浏览器信息需要安装elasticsearch插件
bin/elasticsearch-plugin install ingest-geoip
bin/elasticsearch-plugin install ingest-user-agent
4,设置redis模块
启用redis模块
filebeat modules enable redis
修改redis配置文件
/etc/filebeat/modules.d/redis.yml
- module: redis
  # Main logs
  log:
    enabled: true

    # Set custom paths for the log files. If left empty,
    # Filebeat will choose the paths depending on your OS.
    var.paths: ["/nas/nas/logs/redis/redis-server.log"]

  # Slow logs, retrieved via the Redis API (SLOWLOG)
  slowlog:
    enabled: true

    # The Redis hosts to connect to.
    var.hosts: ["localhost:6379"]

    # Optional, the password to use when connecting to Redis.
    var.password: "password"
kibana页面查看


5,设置kafka模块
启用kafka模块
filebeat modules enable kafka
修改配置文件
/etc/filebeat/modules.d/kafka.yml
- module: kafka
  # All logs
  log:
    enabled: true

    # Set custom paths for Kafka. If left empty,
    # Filebeat will look under /opt.
    #var.kafka_home:

    # Set custom paths for the log files. If left empty,
    # Filebeat will choose the paths depending on your OS.
    var.paths:
      - "/usr/local/kafka/logs/controller.log*"
      - "/usr/local/kafka/logs/server.log*"
      - "/usr/local/kafka/logs/state-change.log*"
      - "/usr/local/kafka/logs/kafka-*.log*"
    # Convert the timestamp to UTC. Requires Elasticsearch >= 6.1.
    #var.convert_timezone: false
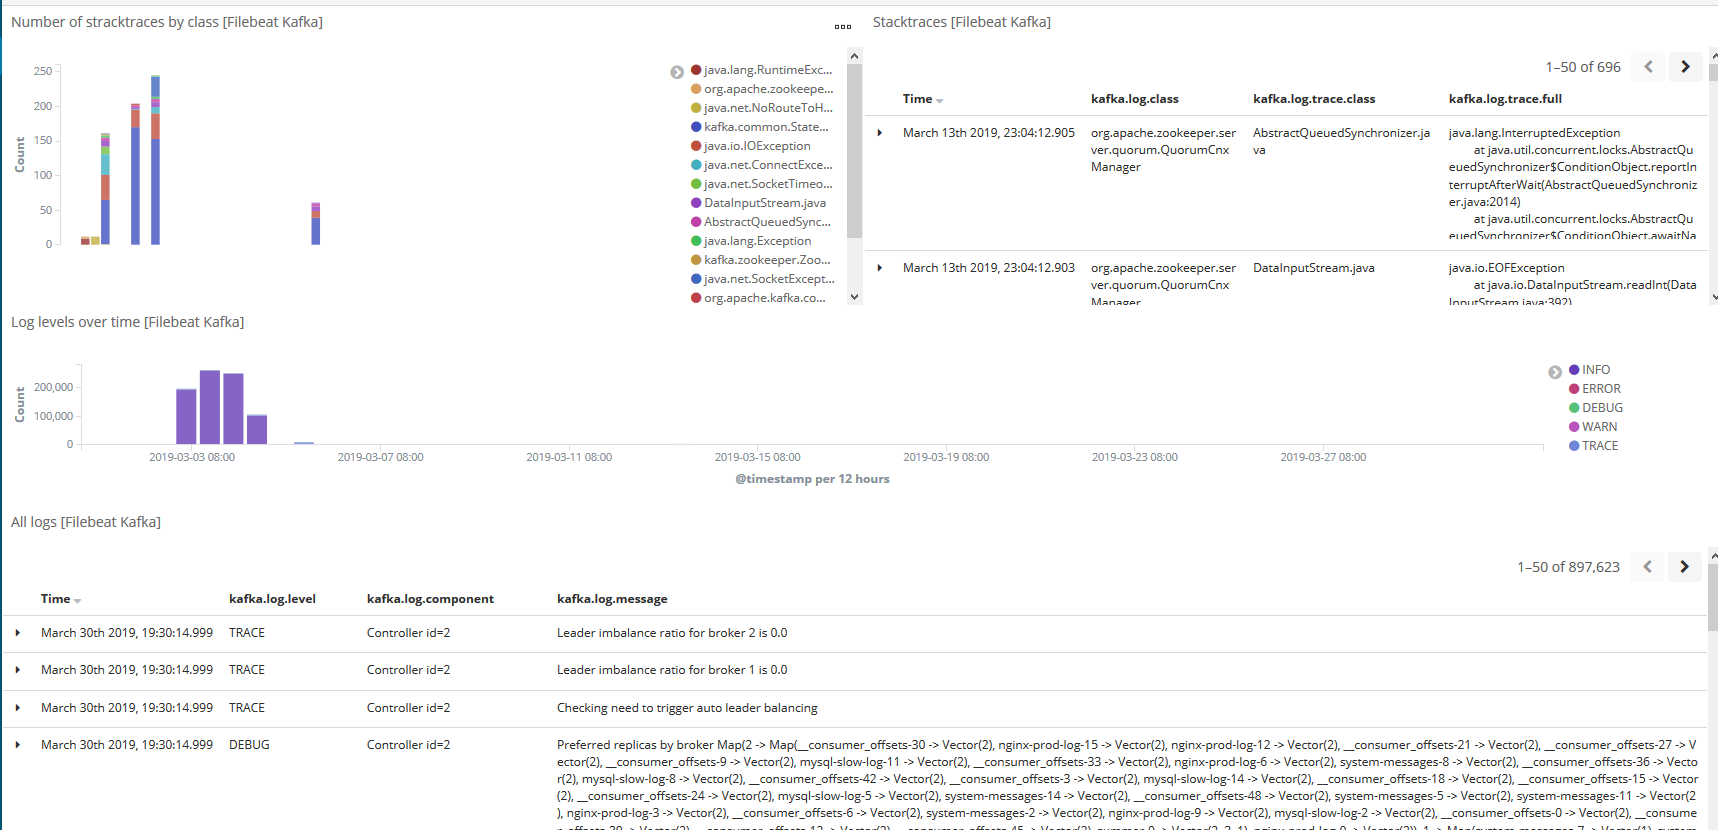
kibana查看

6,设置MySQL模块
开启mysql模块
filebeat modules enable mysql
修改配置文件
/etc/filebeat/modules.d/mysql.yml
输入日志及慢查询日志文件路径
- module: mysql
  # Error logs
  error:
    enabled: true

    # Set custom paths for the log files. If left empty,
    # Filebeat will choose the paths depending on your OS.
    var.paths: ["/var/log/mysql3306.log"]

  # Slow logs
  slowlog:
    enabled: true

    # Set custom paths for the log files. If left empty,
    # Filebeat will choose the paths depending on your OS.
    var.paths: ["/nas/nas/logs/mysql/slow3306.log"]
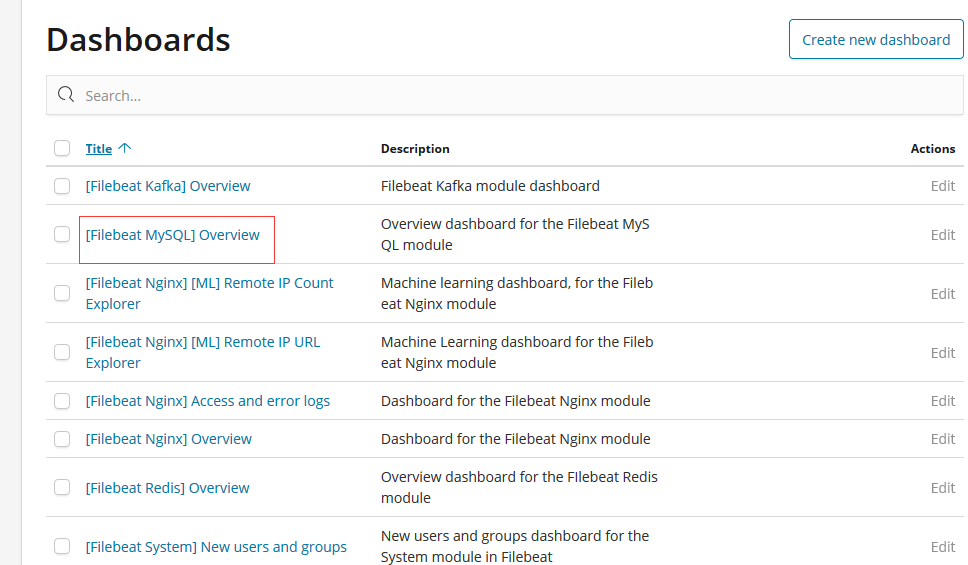
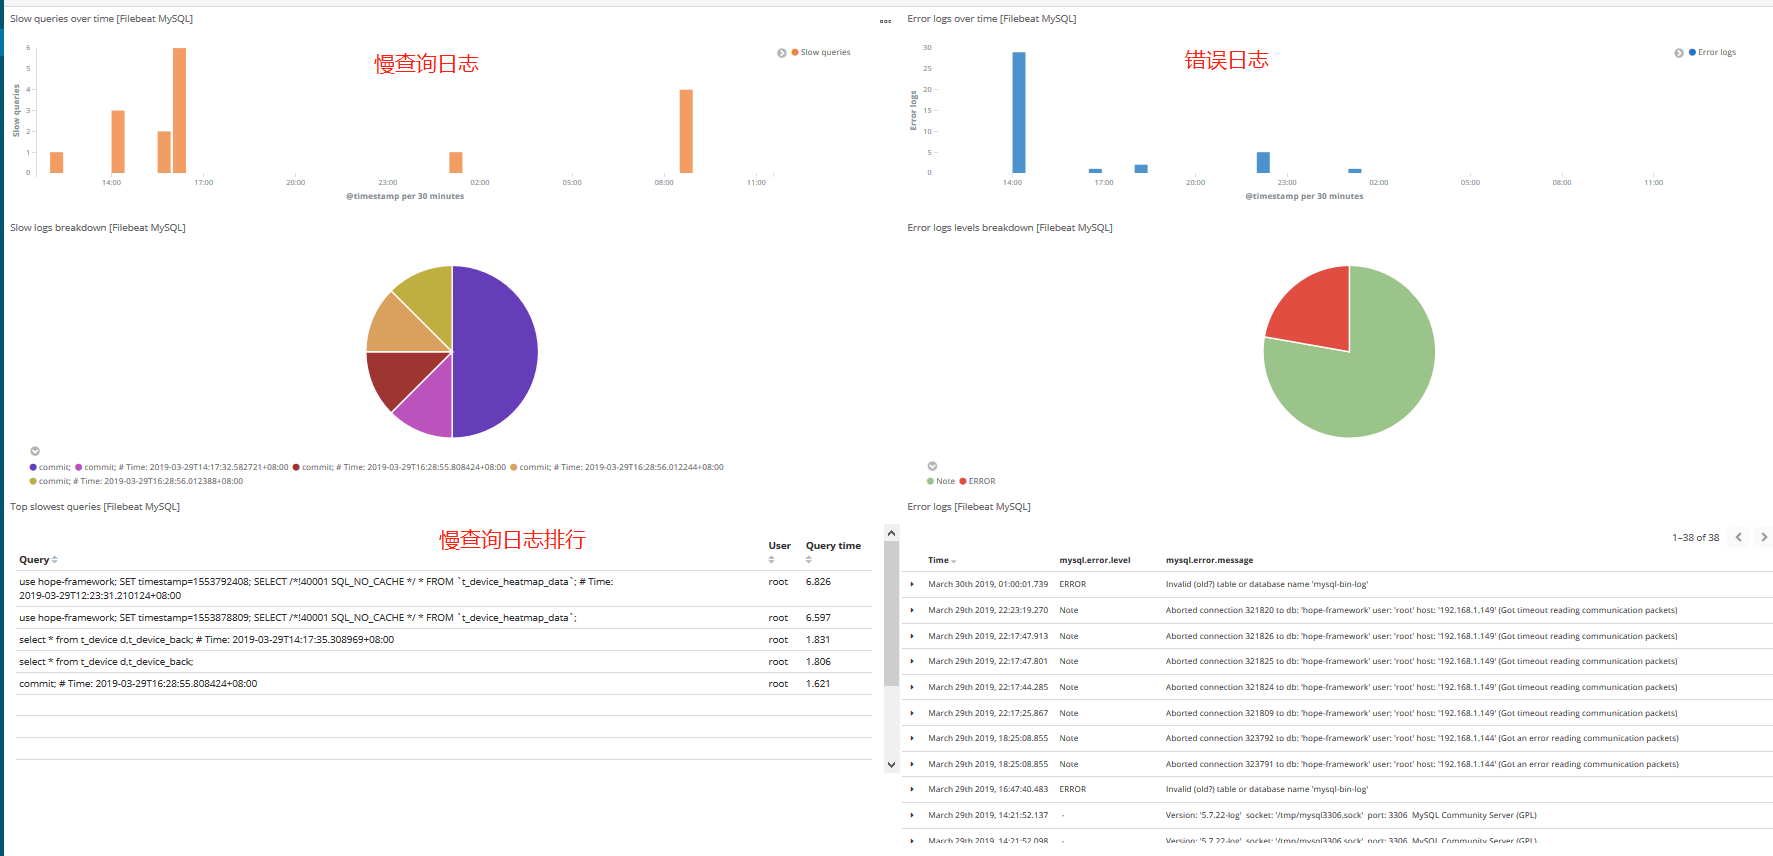
kibana查看
更多模块查看官方文档 https://www.elastic.co/guide/en/beats/filebeat/6.5/filebeat-modules.html

 浙公网安备 33010602011771号