使用ELK收集分析MySQL慢查询日志
参考文档:https://www.cnblogs.com/bixiaoyu/p/9638505.html
MySQL开启慢查询不详述
MySQL5.7慢查询日志格式如下
/usr/local/mysql/bin/mysqld, Version: 5.7.22-log (MySQL Community Server (GPL)). started with:
Tcp port: 3306  Unix socket: /tmp/mysql3306.sock
Time                 Id Command    Argument
# Time: 2019-02-23T01:01:52.922426+08:00
# User@Host: root[root] @  [172.16.90.53]  Id: 25913
# Query_time: 1.393973  Lock_time: 0.000076 Rows_sent: 0  Rows_examined: 0
use hope-framework;
SET timestamp=1550854912;
INSERT INTO t_device_into_near_shop_tmp_data  ( device_mac,
people_in,
people_out,
people_near,
request_message,
start_time,
start_timestamp,
create_time,
create_timestamp )  VALUES  ( 'HA0A00734',
0,
0,
0,
'{"1:Counter 1":0,"0:Counter 0":0,"Records:2 Counter:3":"2000/04/19 20:21:00","2:Counter 2":0}',
'2019-02-23 01:01:51.512',
1550854911512,
'2019-02-23 01:01:51.512',
1550854911512 );
MySQL主机安装filebeat修改配置文件/etc/filebeat/filebeat.yml
filebeat.inputs:
- type: log
enabled: true
paths:
- /opt/log/mysql/slow3306.log
#- c:\programdata\elasticsearch\logs\*
exclude_lines: ['^\# Time|^/usr/local/mysql/bin/mysqld|^Tcp port|^Time'] #排除行
multiline.negate: true #多行合并
multiline.match: after
multiline.pattern: '^\# User|^\# Time'
tags: ["mysql-slow-log"] #打一个tags
filebeat.config.modules:
path: ${path.config}/modules.d/*.yml
reload.enabled: false
setup.template.settings:
index.number_of_shards: 3
setup.kibana:
output.logstash: #输出至logstash
hosts: ["192.168.1.4:5044"]
processors:
- add_host_metadata: ~
- add_cloud_metadata: ~
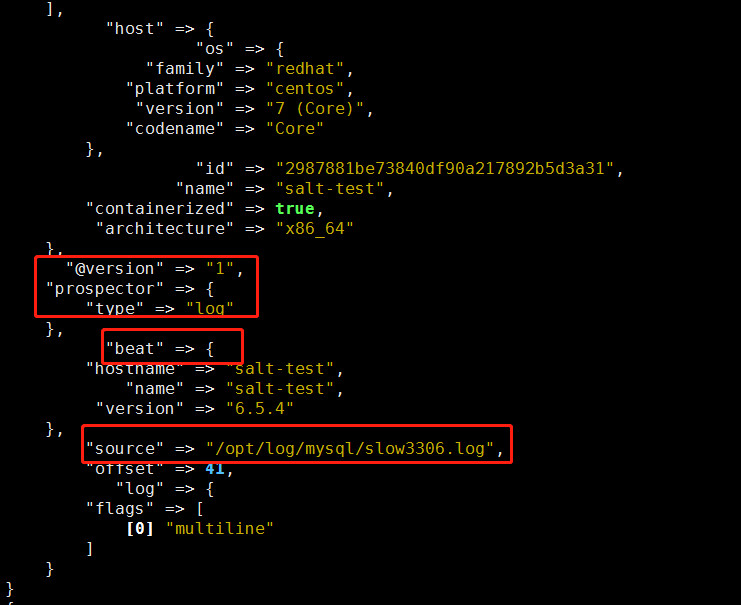
- drop_fields: #删除无用的字段
fields: ["beat", "input", "source", "offset", "prospector"]
PS:删除的无用字段为以下几个字段
修改logstash输出测试/etc/logstash/conf.d/filebeat-logstash.conf
input{
    beats{
        port => 5044
    }
}

output{
    if "mysql-slow-log" in [tags] {
        stdout{
            codec => rubydebug
        }
     }
}
运行logstash
/usr/share/logstash/bin/logstash -f /etc/logstash/conf.d/filebeat-logstash.conf
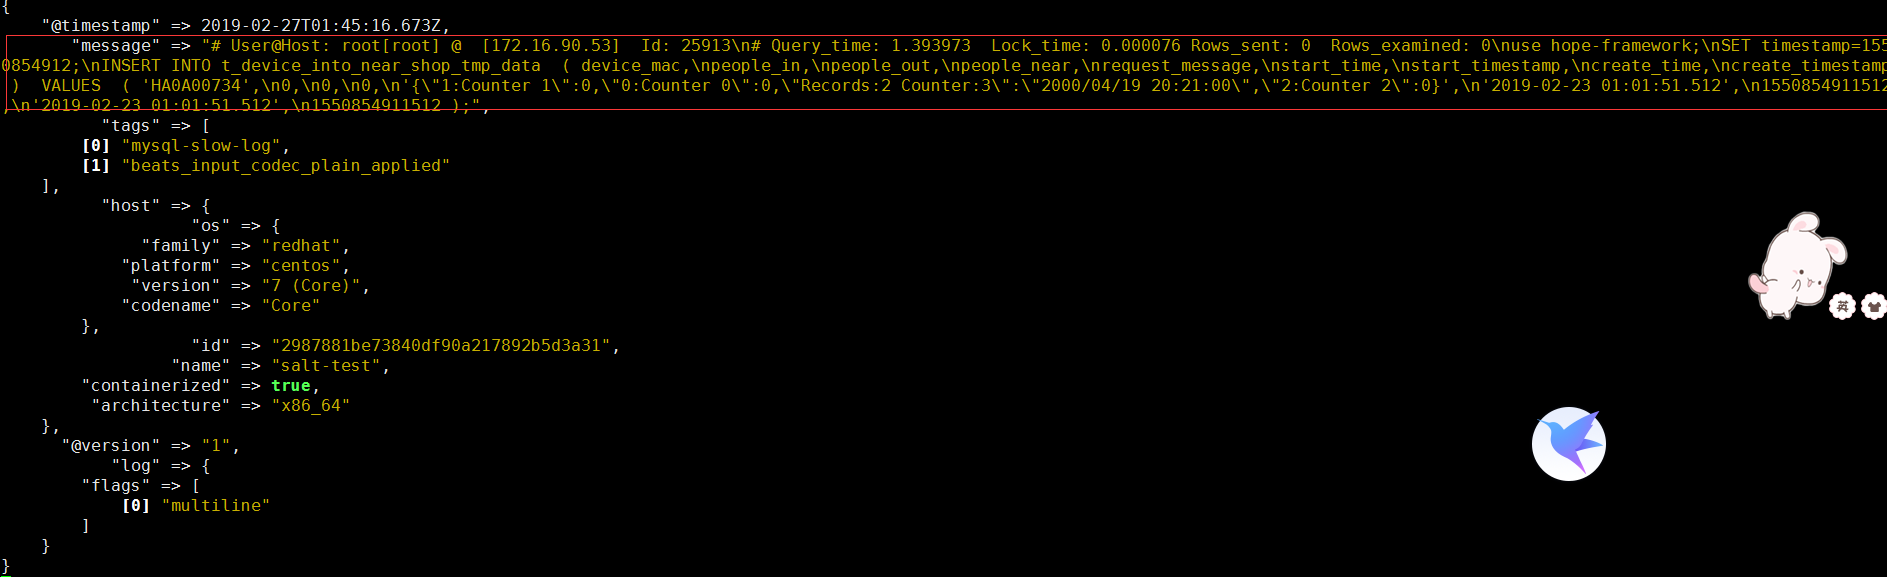
多行输出如下
增加filter过滤
input{
    beats{
        port => 5044
    }
}
filter {
    if "mysql-slow-log" in [tags] {
    json {
        source => "message"
    }
 grok {
        match => [ "message" , "(?m)^#\s+User@Host:\s+%{USER:user}\[[^\]]+\]\s+@\s+(?:(?<clienthost>\S*) )?\[(?:%{IPV4:clientip})?\]\s+Id:\s+%{NUMBER:row_id:int}\n#\s+Query_time:\s+%{NUMBER:query_time:float}\s+Lock_time:\s+%{NUMBER:lock_time:float}\s+Rows_sent:\s+%{NUMBER:rows_sent:int}\s+Rows_examined:\s+%{NUMBER:rows_examined:int}\n\s*(?:use %{DATA:database};\s*\n)?SET\s+timestamp=%{NUMBER:timestamp};\n\s*(?<sql>(?<action>\w+)\b.*;)\s*(?:\n#\s+Time)?.*$" ]
    }

    date {
        match => ["timestamp_mysql","UNIX"]   #这里我们需要对日志输出进行时间格式转换,默认将timestamp_mysql的unix时间格式之后直接赋值给timestamp
        target => "@timestamp"
    }
    mutate {
            remove_field => "@version"   #版本字段,删除不需要的字段
            remove_field => "message"    #在上述,我们已经对mysql的慢日志输出分段了,所以message输出已经是多余的了,故此删除
    }
 }
}

output{
    if "mysql-slow-log" in [tags] {
        elasticsearch{
        hosts => ["192.168.1.4:9200"]
        index => "mysql-slow-log-%{+YYYY.MM}"
        }
        stdout{
            codec => rubydebug
        }
    }
}
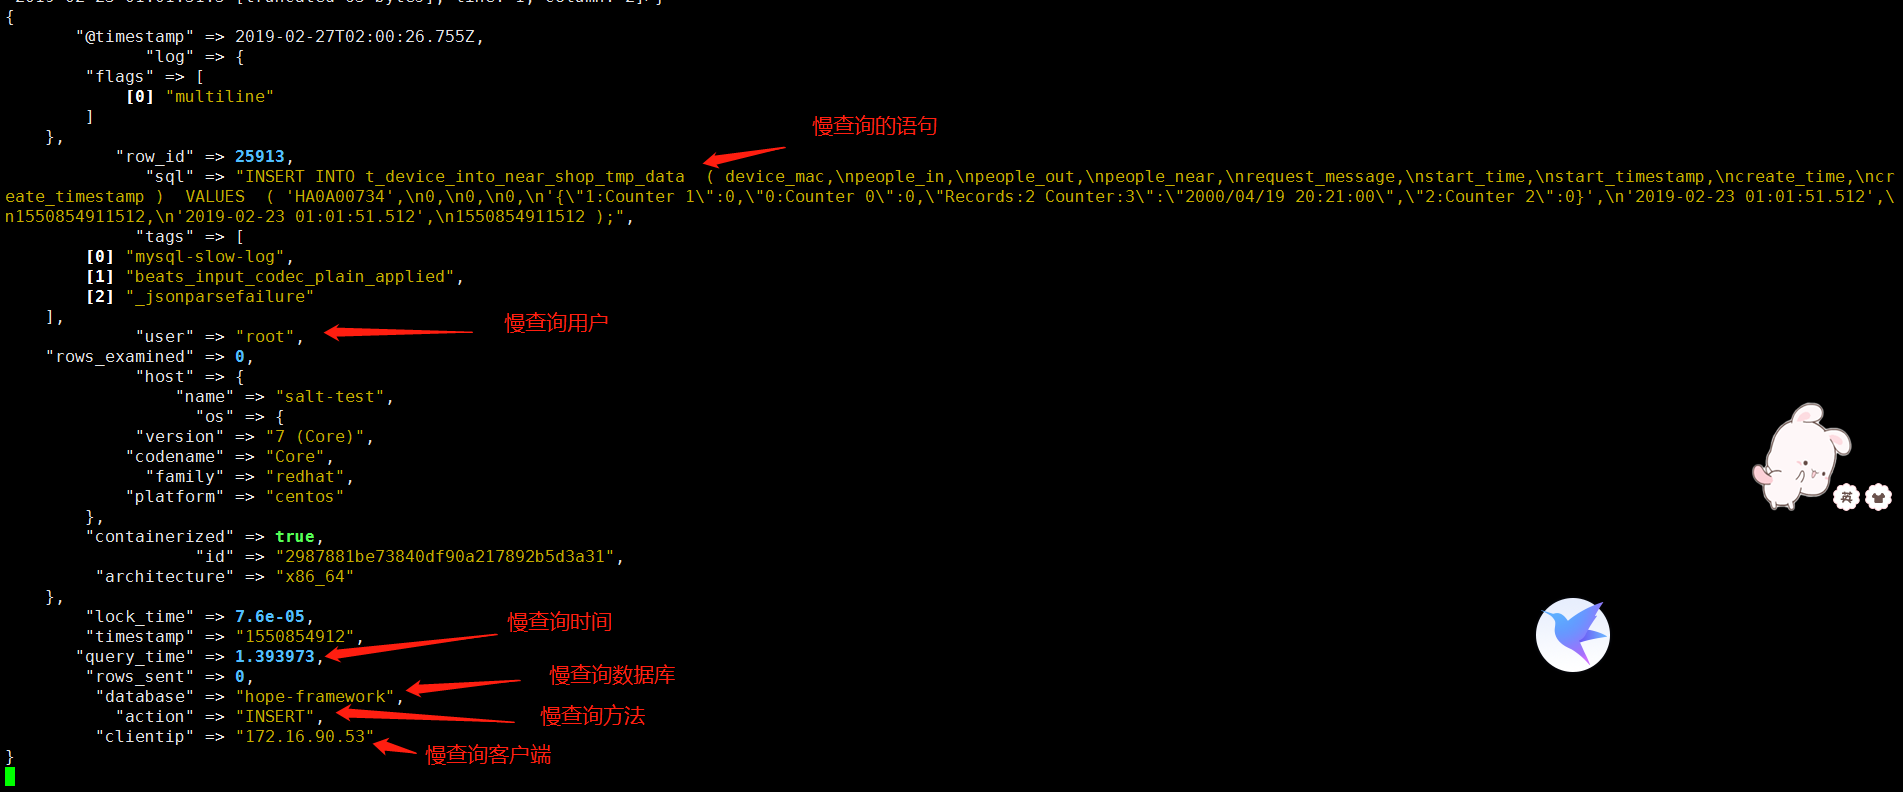
运行再次输出测试
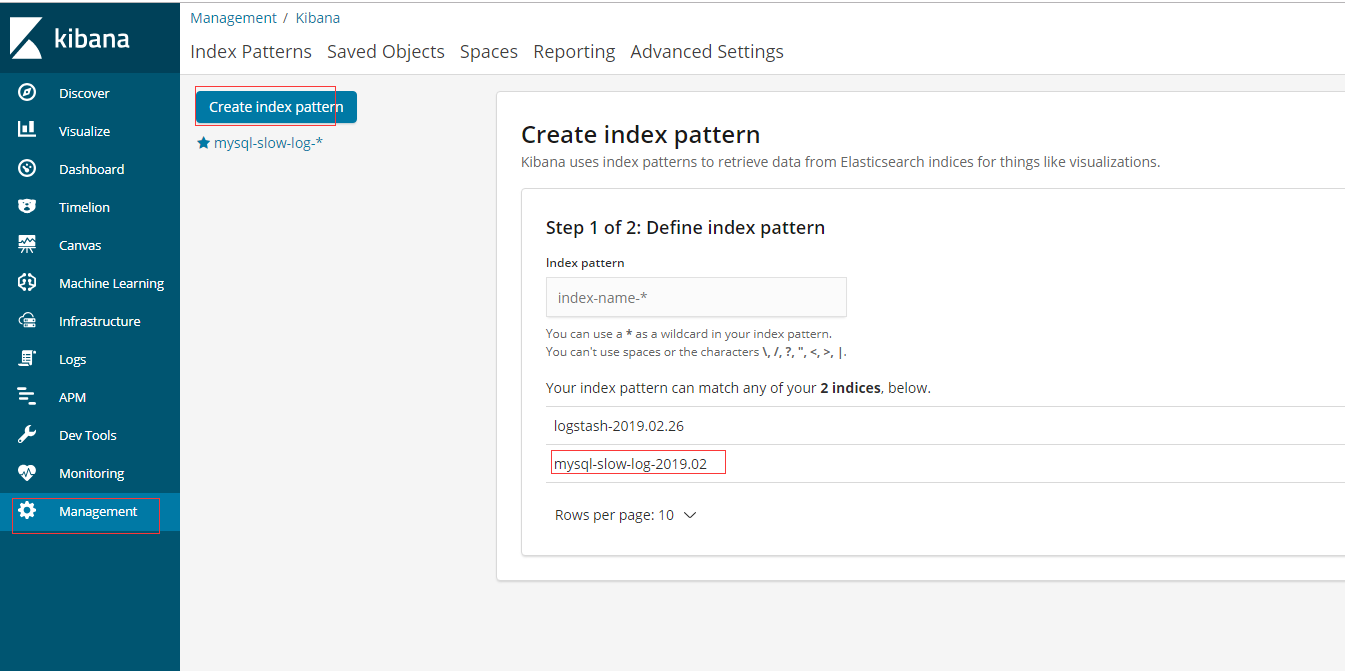
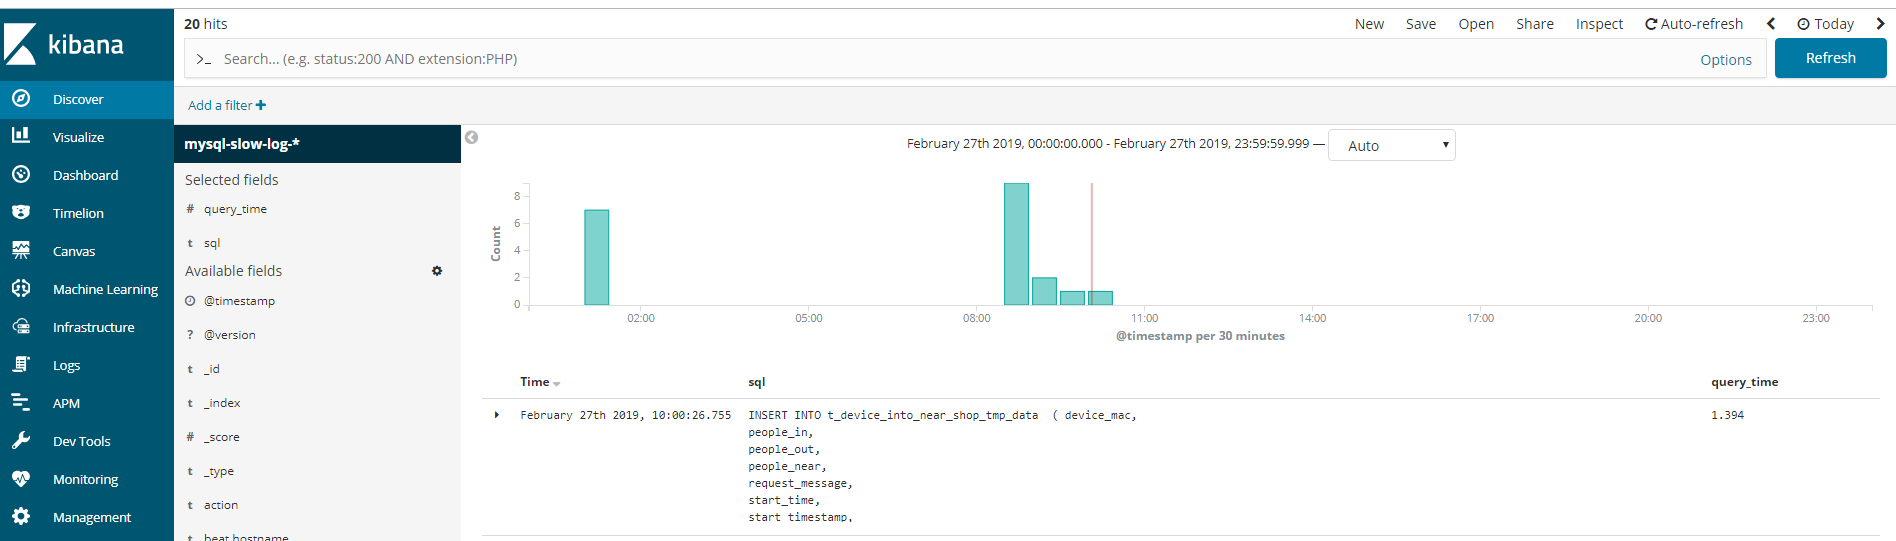
输出至elasticsearch即可使用kibana查询
在kibana添加

 浙公网安备 33010602011771号