

LiveCharts2:简单灵活交互式且功能强大的.NET图表库
前言
之前的文章中提到过ScottPlot、与oxyplot,这两个是比较常用的.NET图表库,今天介绍一款新的.NET图表库:LiveCharts2。
LiveCharts2介绍
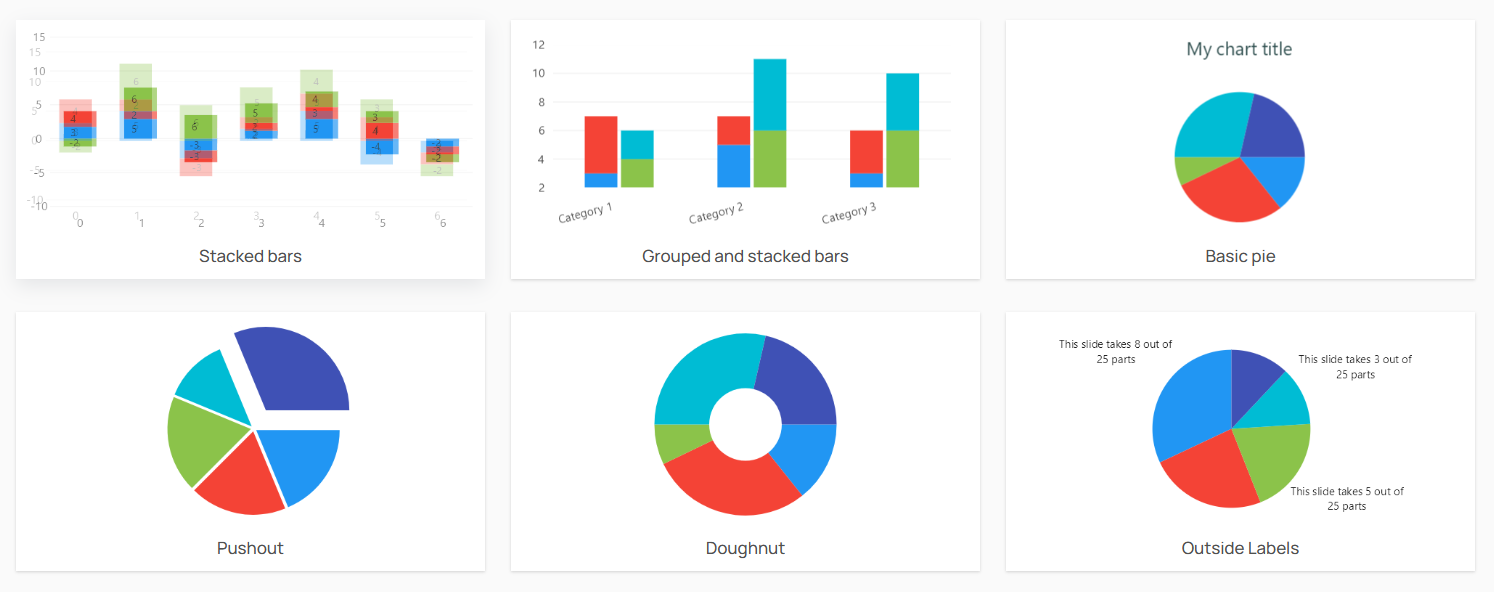
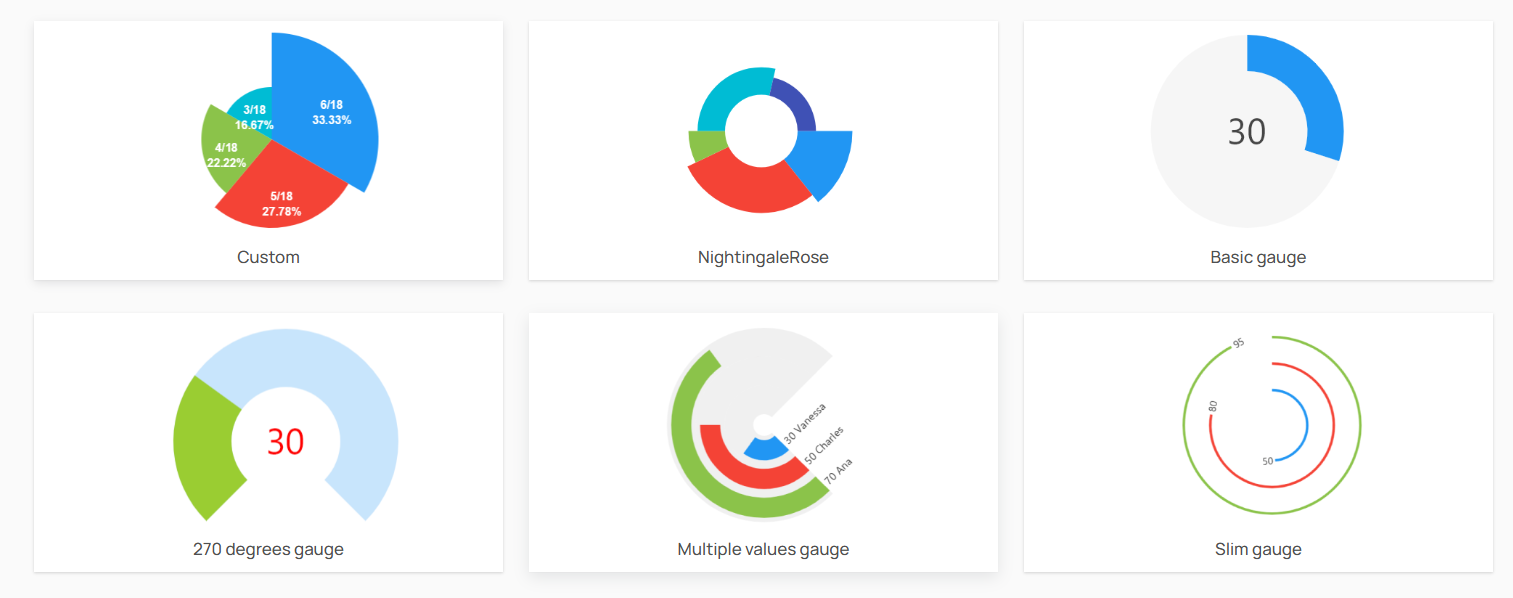
LiveCharts2 是一个现代化的数据可视化库,用于创建动态和交互式图表,支持 .NET 平台。它是 LiveCharts 的进化版,旨在提供更高性能、更灵活和更易于使用的图表解决方案。LiveCharts2 支持多种图表类型,包括折线图、柱状图、饼图、散点图等,适用于各种数据展示需求。
该库采用 MVVM(Model-View-ViewModel)设计模式,方便开发者在应用中进行数据绑定和动态更新。LiveCharts2 强调性能优化,能够处理大量数据并提供流畅的交互体验。
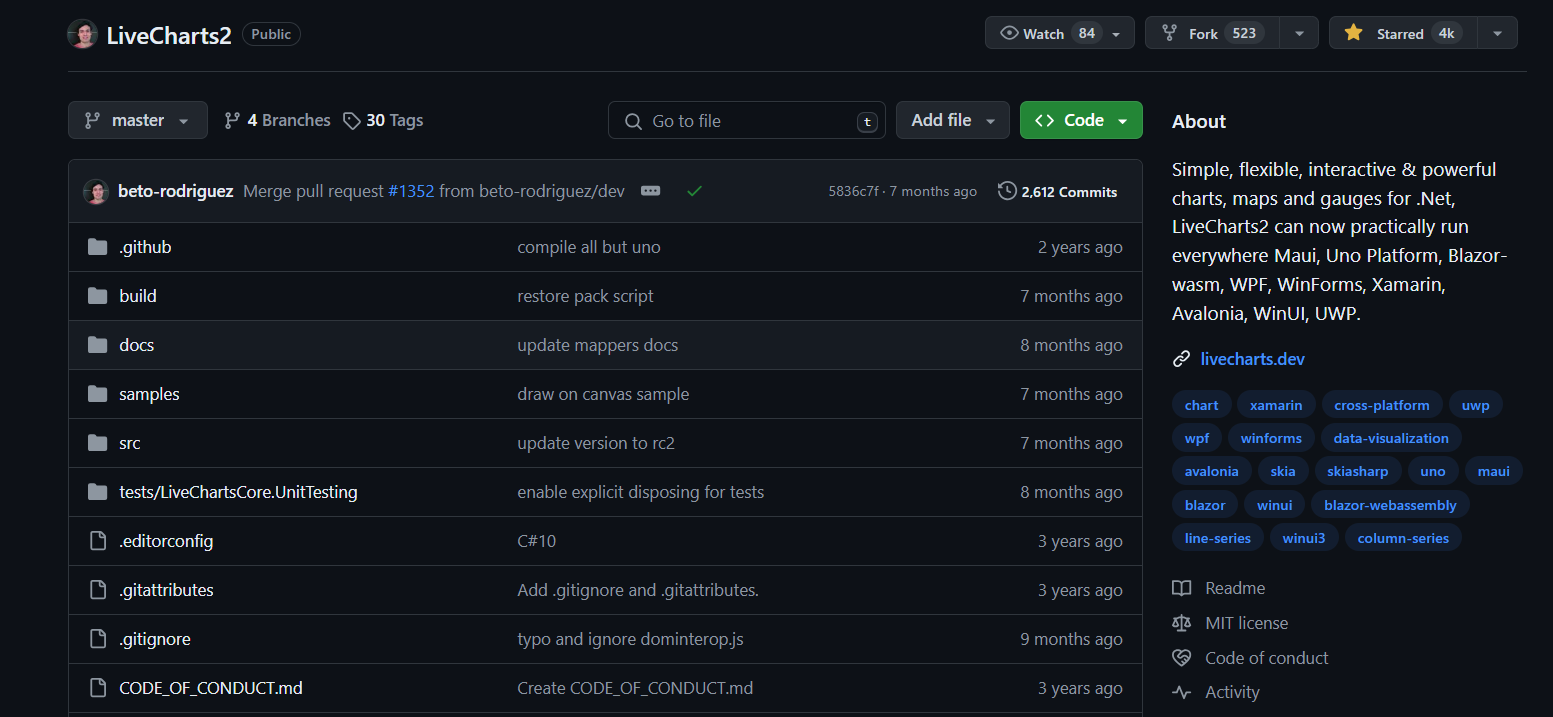
GitHub上的介绍如下:
Simple, flexible, interactive & powerful charts, maps and gauges for .Net, LiveCharts2 can now practically run everywhere Maui, Uno Platform, Blazor-wasm, WPF, WinForms, Xamarin, Avalonia, WinUI, UWP.
简单、灵活、交互式且功能强大,适用于 .NET的图表、地图和仪表库,现在可以在 Maui、Uno Platform、Blazor-wasm、WPF、WinForms、Xamarin、Avalonia、WinUI、UWP上运行。
截止写这篇文章,该项目获得了4k个Starts。
简单使用
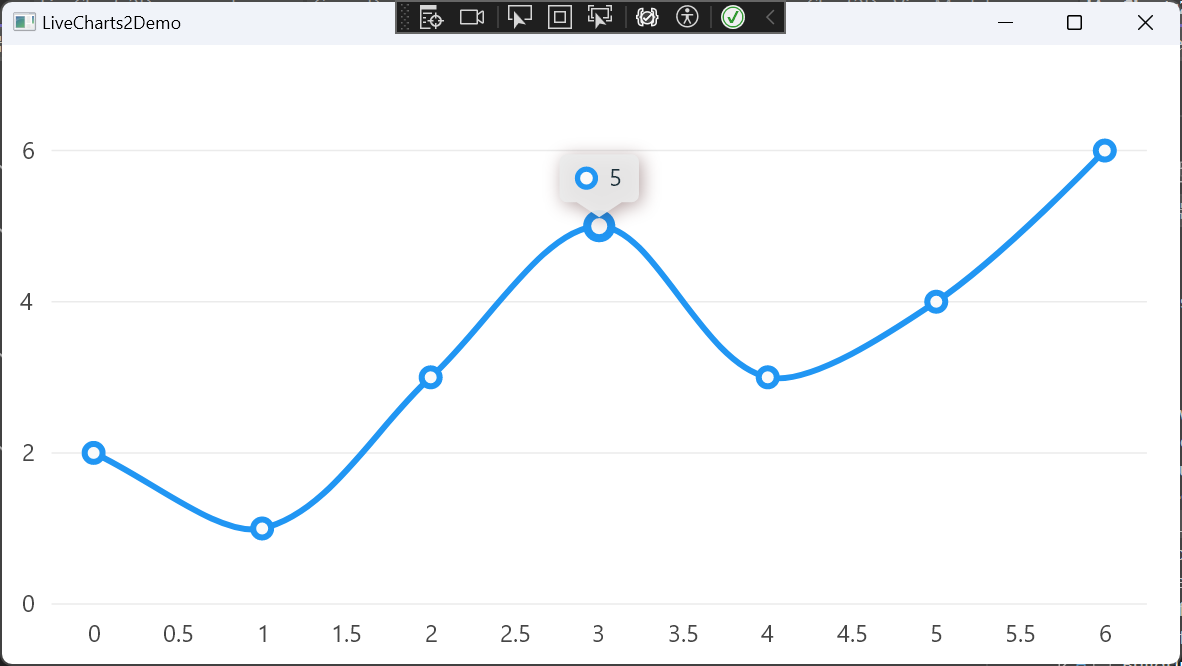
画折线图
安装NuGet包:
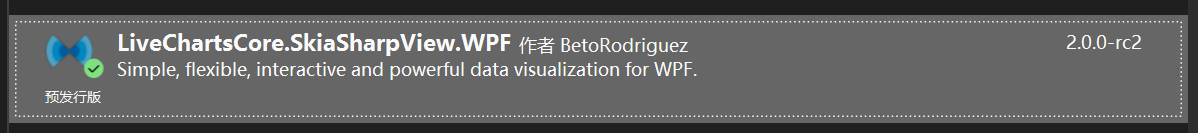
需要点击包含预发行版才会出现。
在ViewModel中添加一个Series属性,如下所示:
 public partial class LiveChart2DemoViewModel : ObservableObject
 {
     public ISeries[] Series { get; set; }
        = new ISeries[]
        {
               new LineSeries<double>
               {
                         Values = new double[] { 2, 1, 3, 5, 3, 4, 6 },
                         Fill = null
               }
        };
 }
在xaml页面,添加命名空间,如下所示:
xmlns:lvc="clr-namespace:LiveChartsCore.SkiaSharpView.WPF;assembly=LiveChartsCore.SkiaSharpView.WPF"
添加控件:
 <lvc:CartesianChart
        Series="{Binding Series}">
 </lvc:CartesianChart>
最后不要忘了设置页面的DataContext,如下所示:
 public partial class LiveCharts2Demo : Window
 {
     public LiveCharts2Demo()
     {
         InitializeComponent();
         this.DataContext = new LiveChart2DemoViewModel();
     }
 }
实现效果如下:
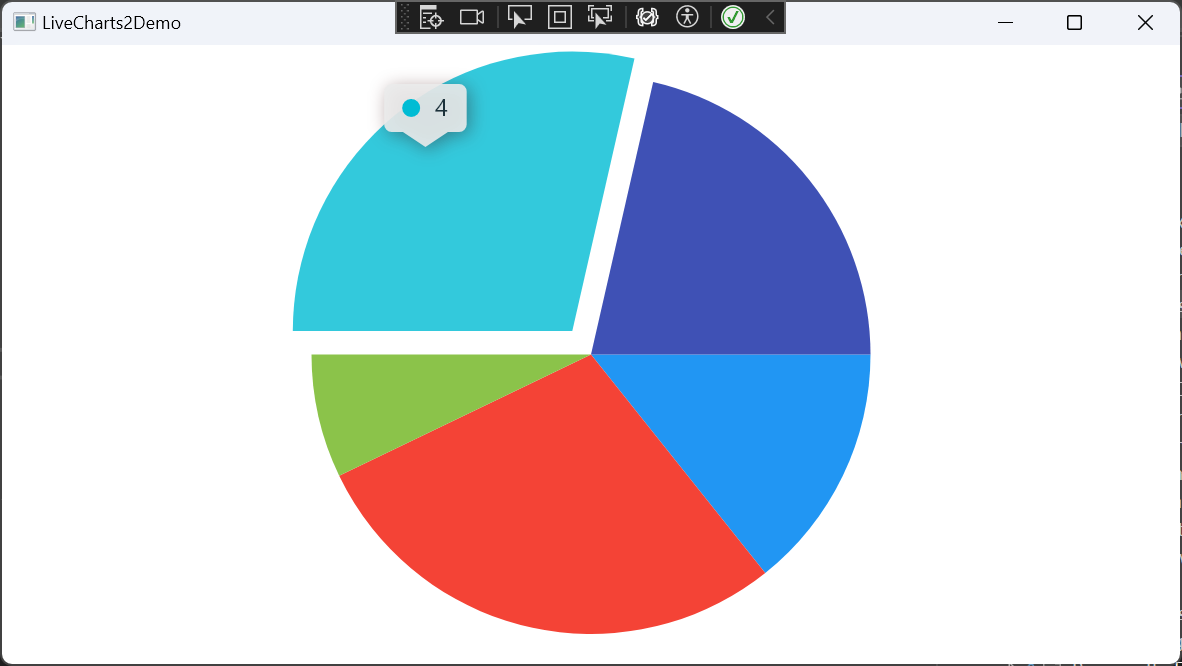
画饼图
将Series属性修改为:
 public ISeries[] Series { get; set; }
       = new ISeries[]
       {
         new PieSeries<double> { Values = new double[] { 2 } },
         new PieSeries<double> { Values = new double[] { 4 } },
         new PieSeries<double> { Values = new double[] { 1 } },
         new PieSeries<double> { Values = new double[] { 4 } },
         new PieSeries<double> { Values = new double[] { 3 } }
       };
添加控件:
<lvc:PieChart
    Series="{Binding Series}">
</lvc:PieChart>
效果如下所示:
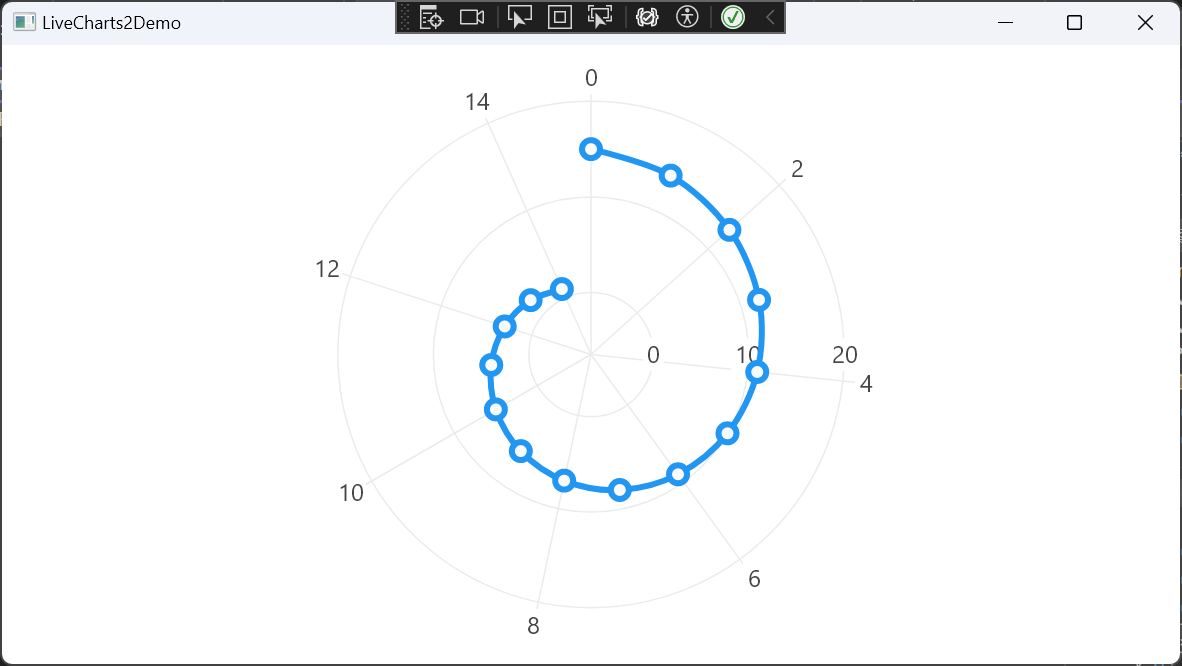
画极坐标图
将Series属性修改为:
public ISeries[] Series { get; set; } = new[]
        {
            new PolarLineSeries<double>
            {
                Values = new double[] { 15, 14, 13, 12, 11, 10, 9, 8, 7, 6, 5, 4, 3, 2, 1 },
                Fill = null,
                IsClosed = false
            }
        };
添加控件:
 <lvc:PolarChart
       Series="{Binding Series}">
 </lvc:PolarChart>
效果如下所示:
更多示例可见官网:
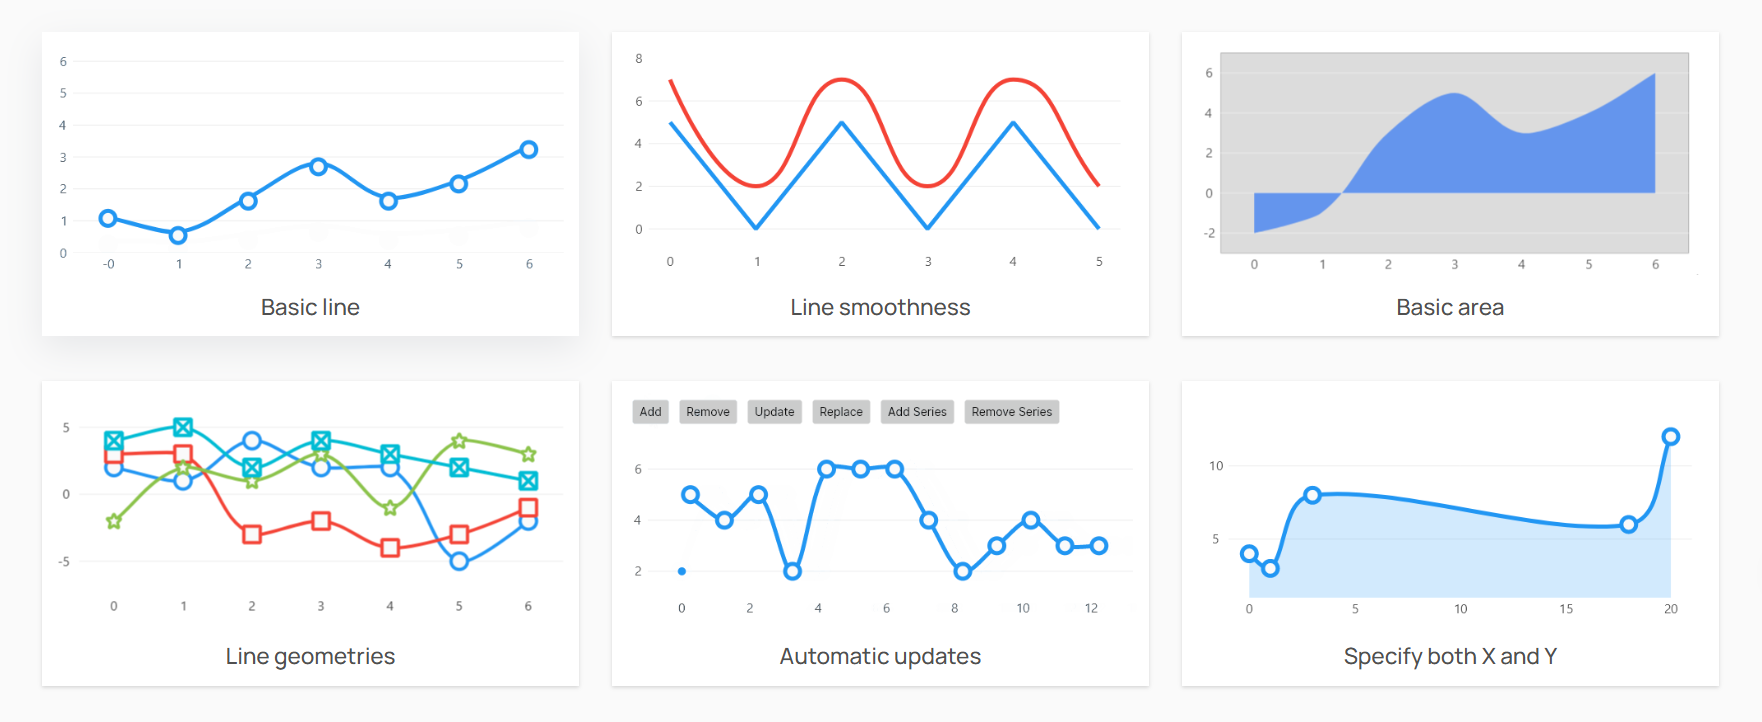
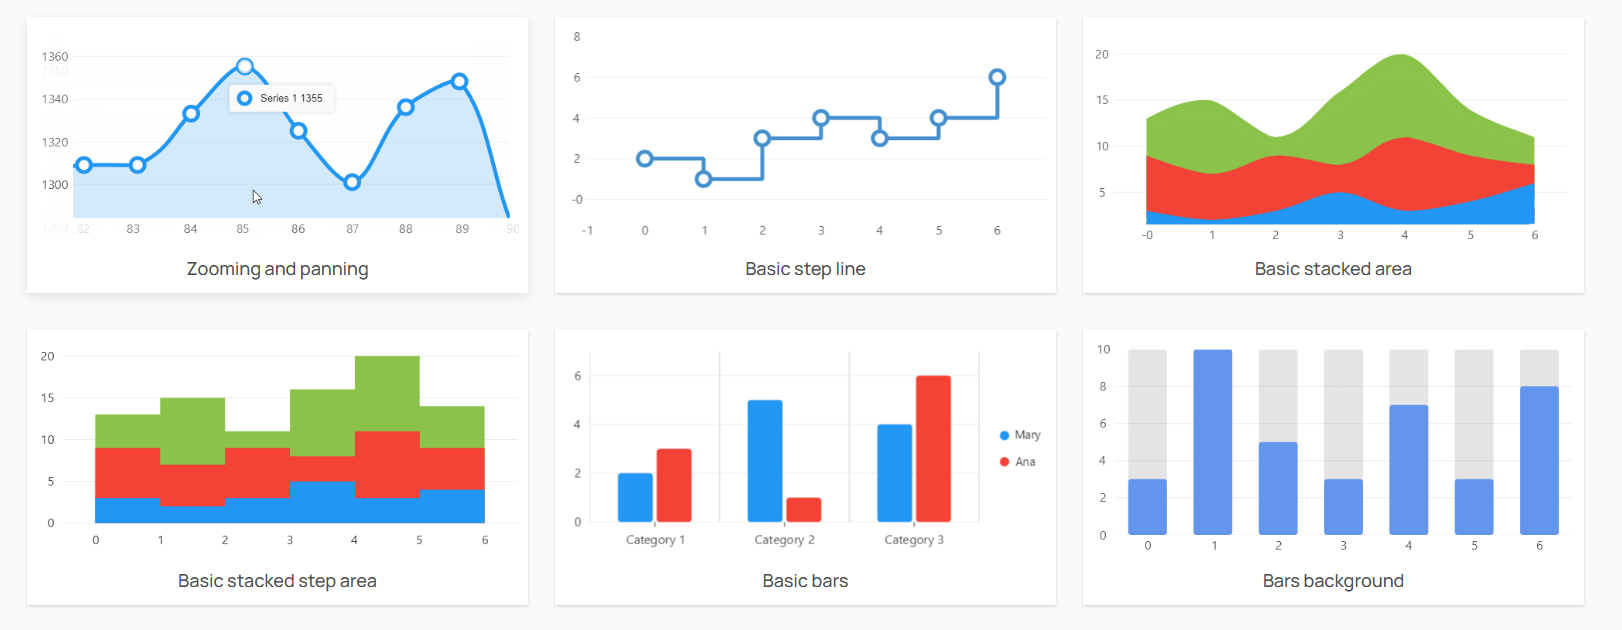
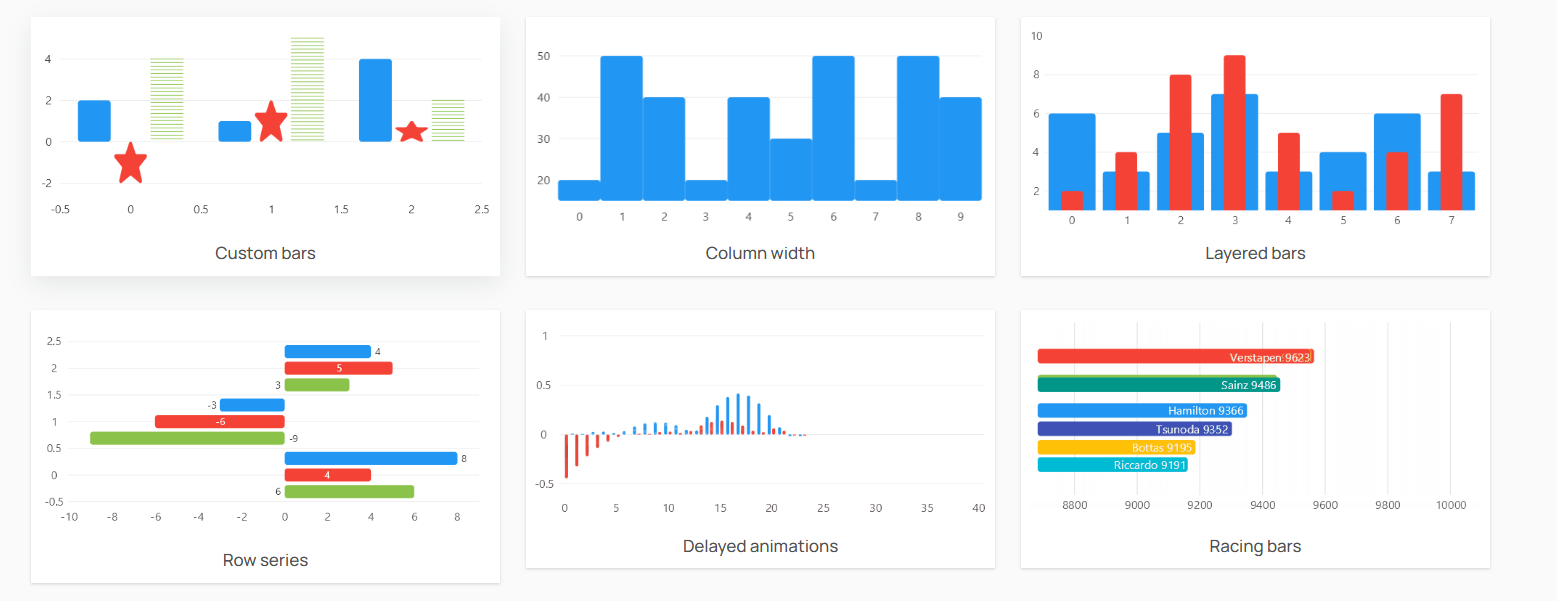
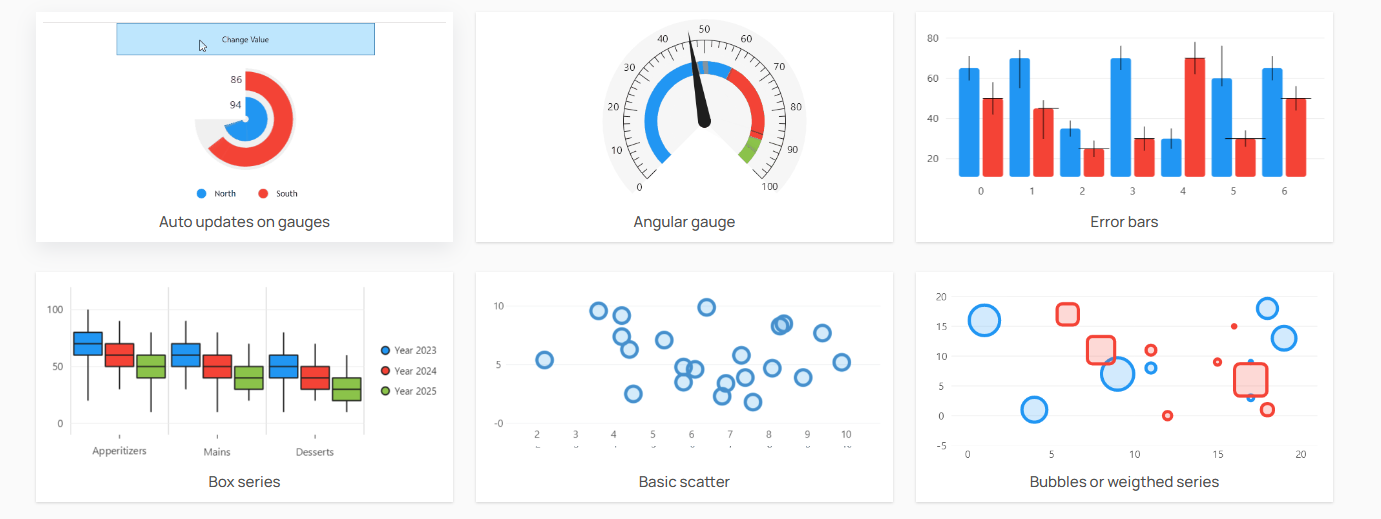
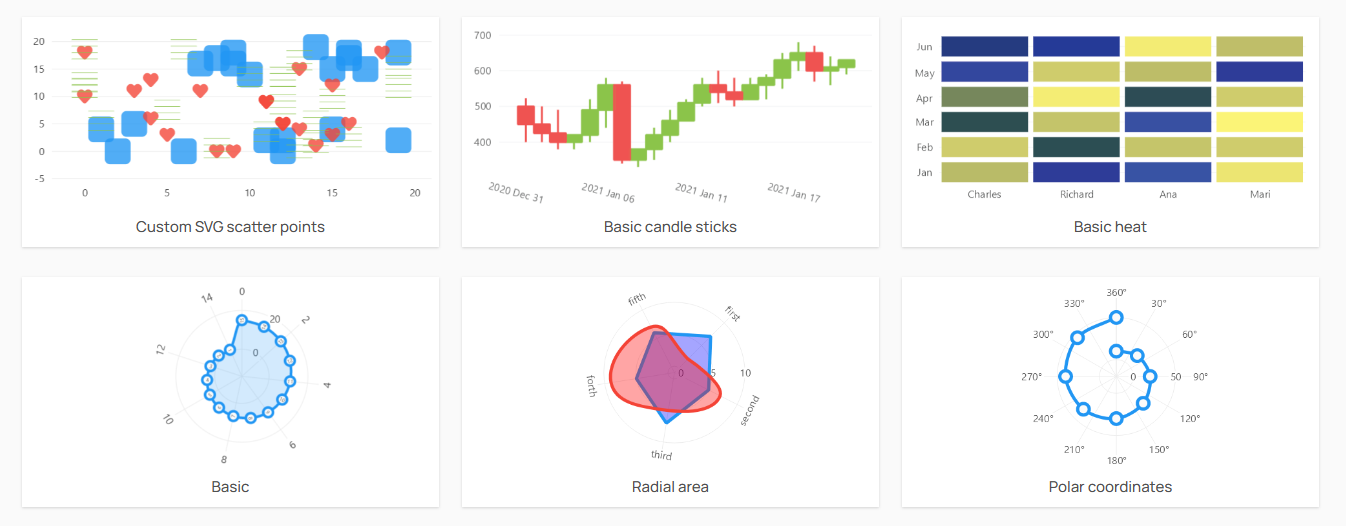
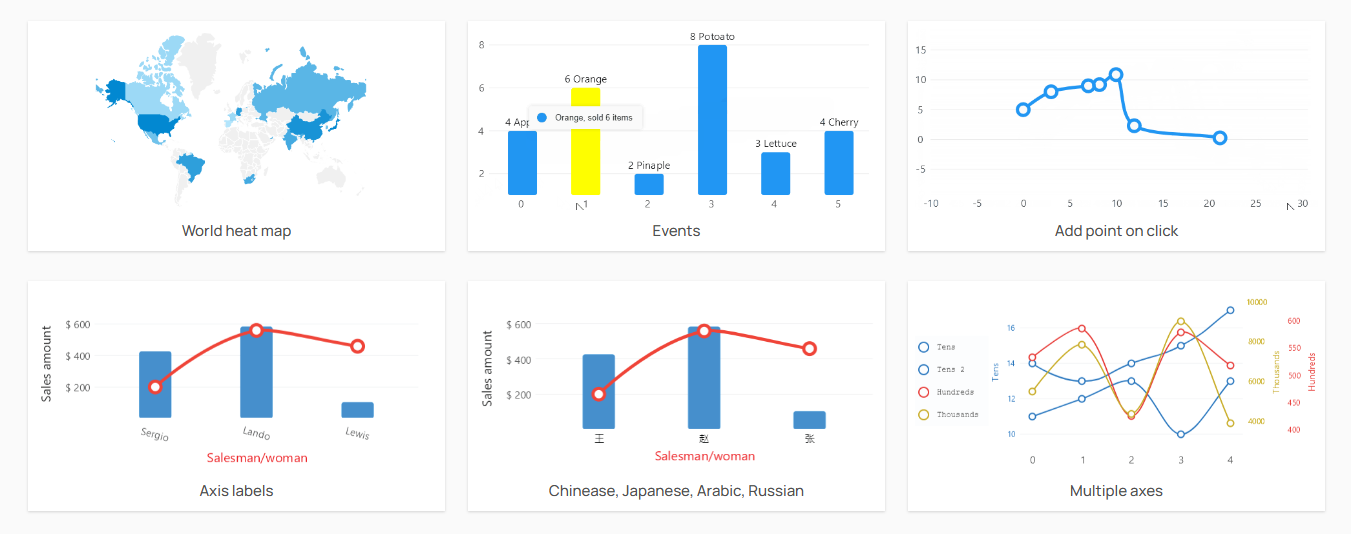
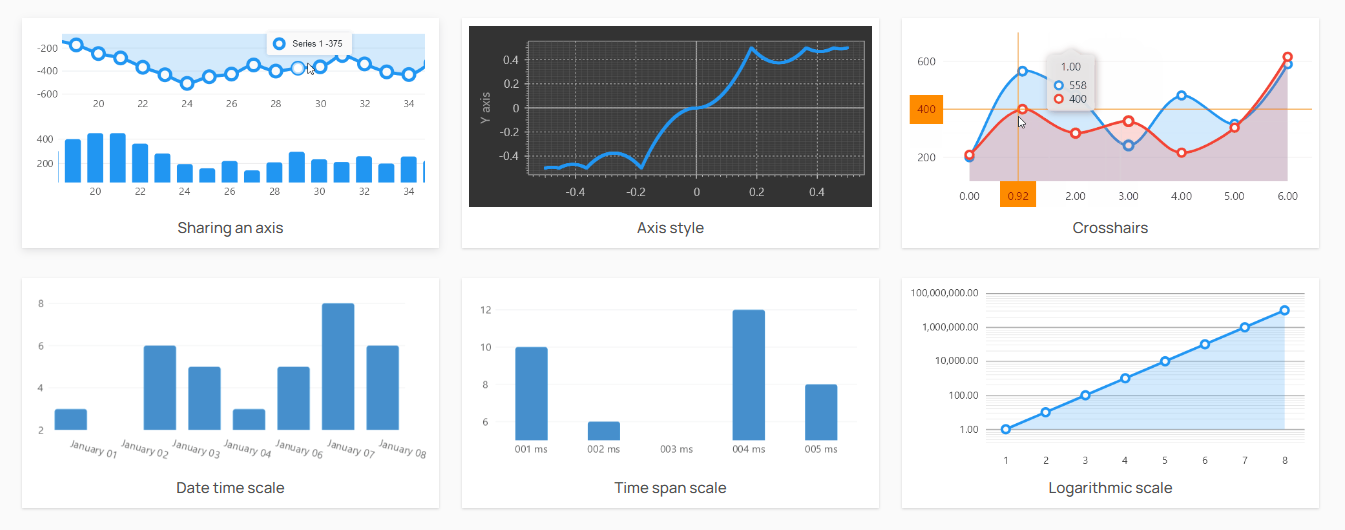
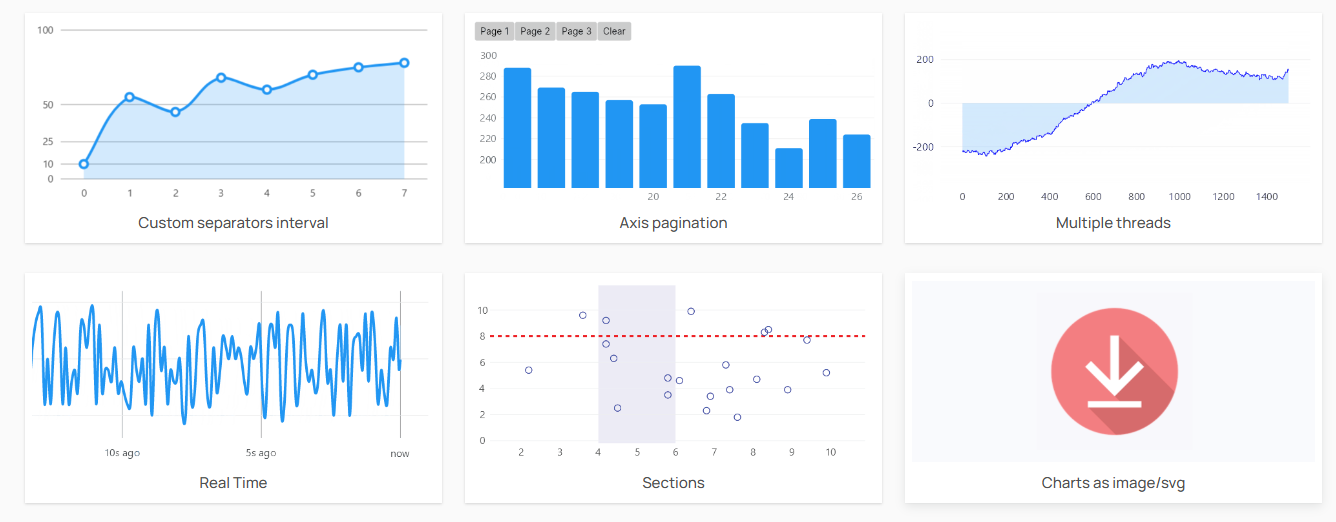
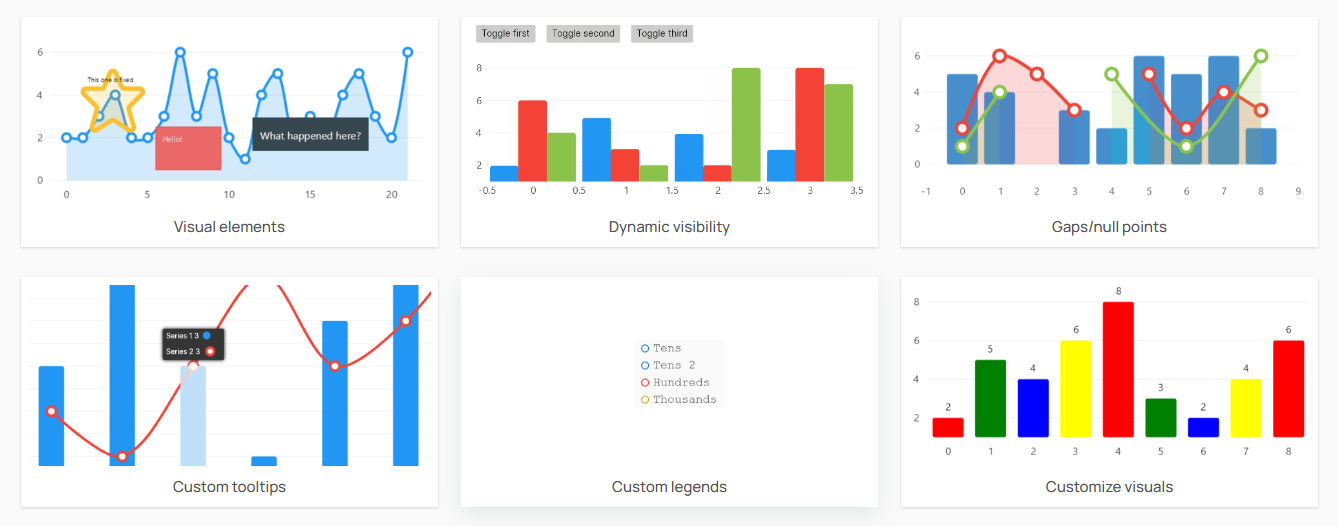
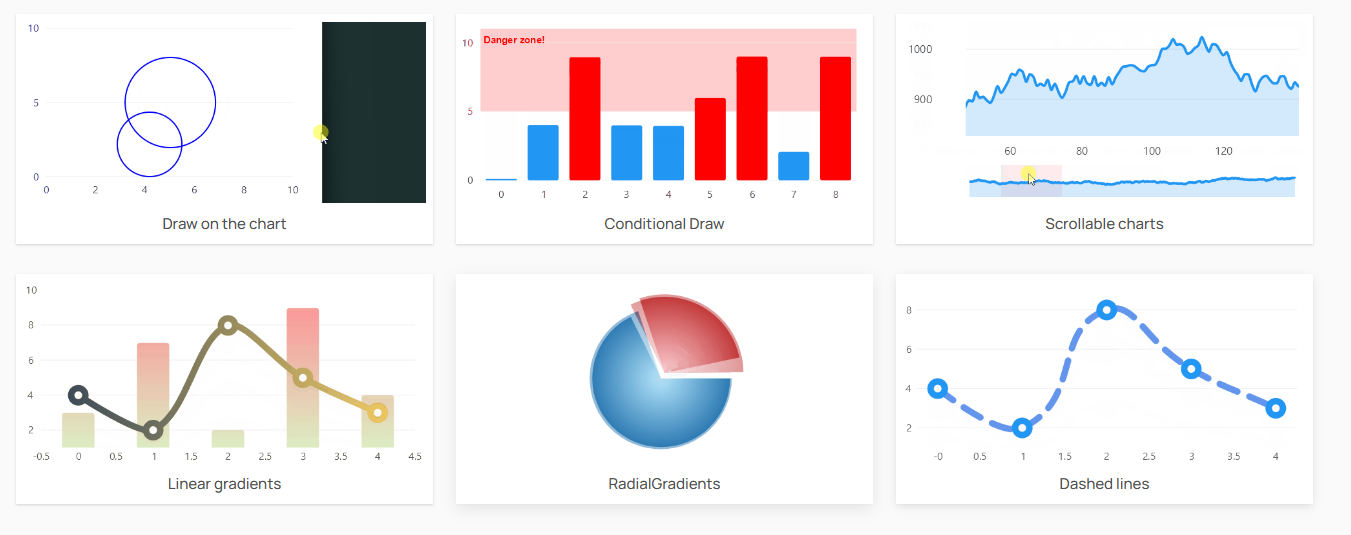
官网提供了多种多样的样式,可以根据自己的需求,去官网上选择合适的图表样式。
