
【Java】使用Druid连接池的监控面板排查慢SQL
默认在后台服务的地址:
http://localhost:8078/druid/login.html
账号信息放在配置文件中获取:
server:
  port: 8078

spring:
  datasource:
    druid:
      stat-view-servlet:
        loginUsername: admin # 访问druid监控界面的用户名密码
        loginPassword: 123456
      max-pool-prepared-statement-per-connection-size: 20
      filters: stat,wall
      connectionProperties: druid.stat.mergeSql=true;druid.stat.slowSqlMillis=5000
starter依赖:
		<dependency>
			<groupId>com.alibaba</groupId>
			<artifactId>druid-spring-boot-starter</artifactId>
			<version>1.1.10</version>
		</dependency>
登陆后,主要看这两个功能:

【SQL监控】和【URI监控】
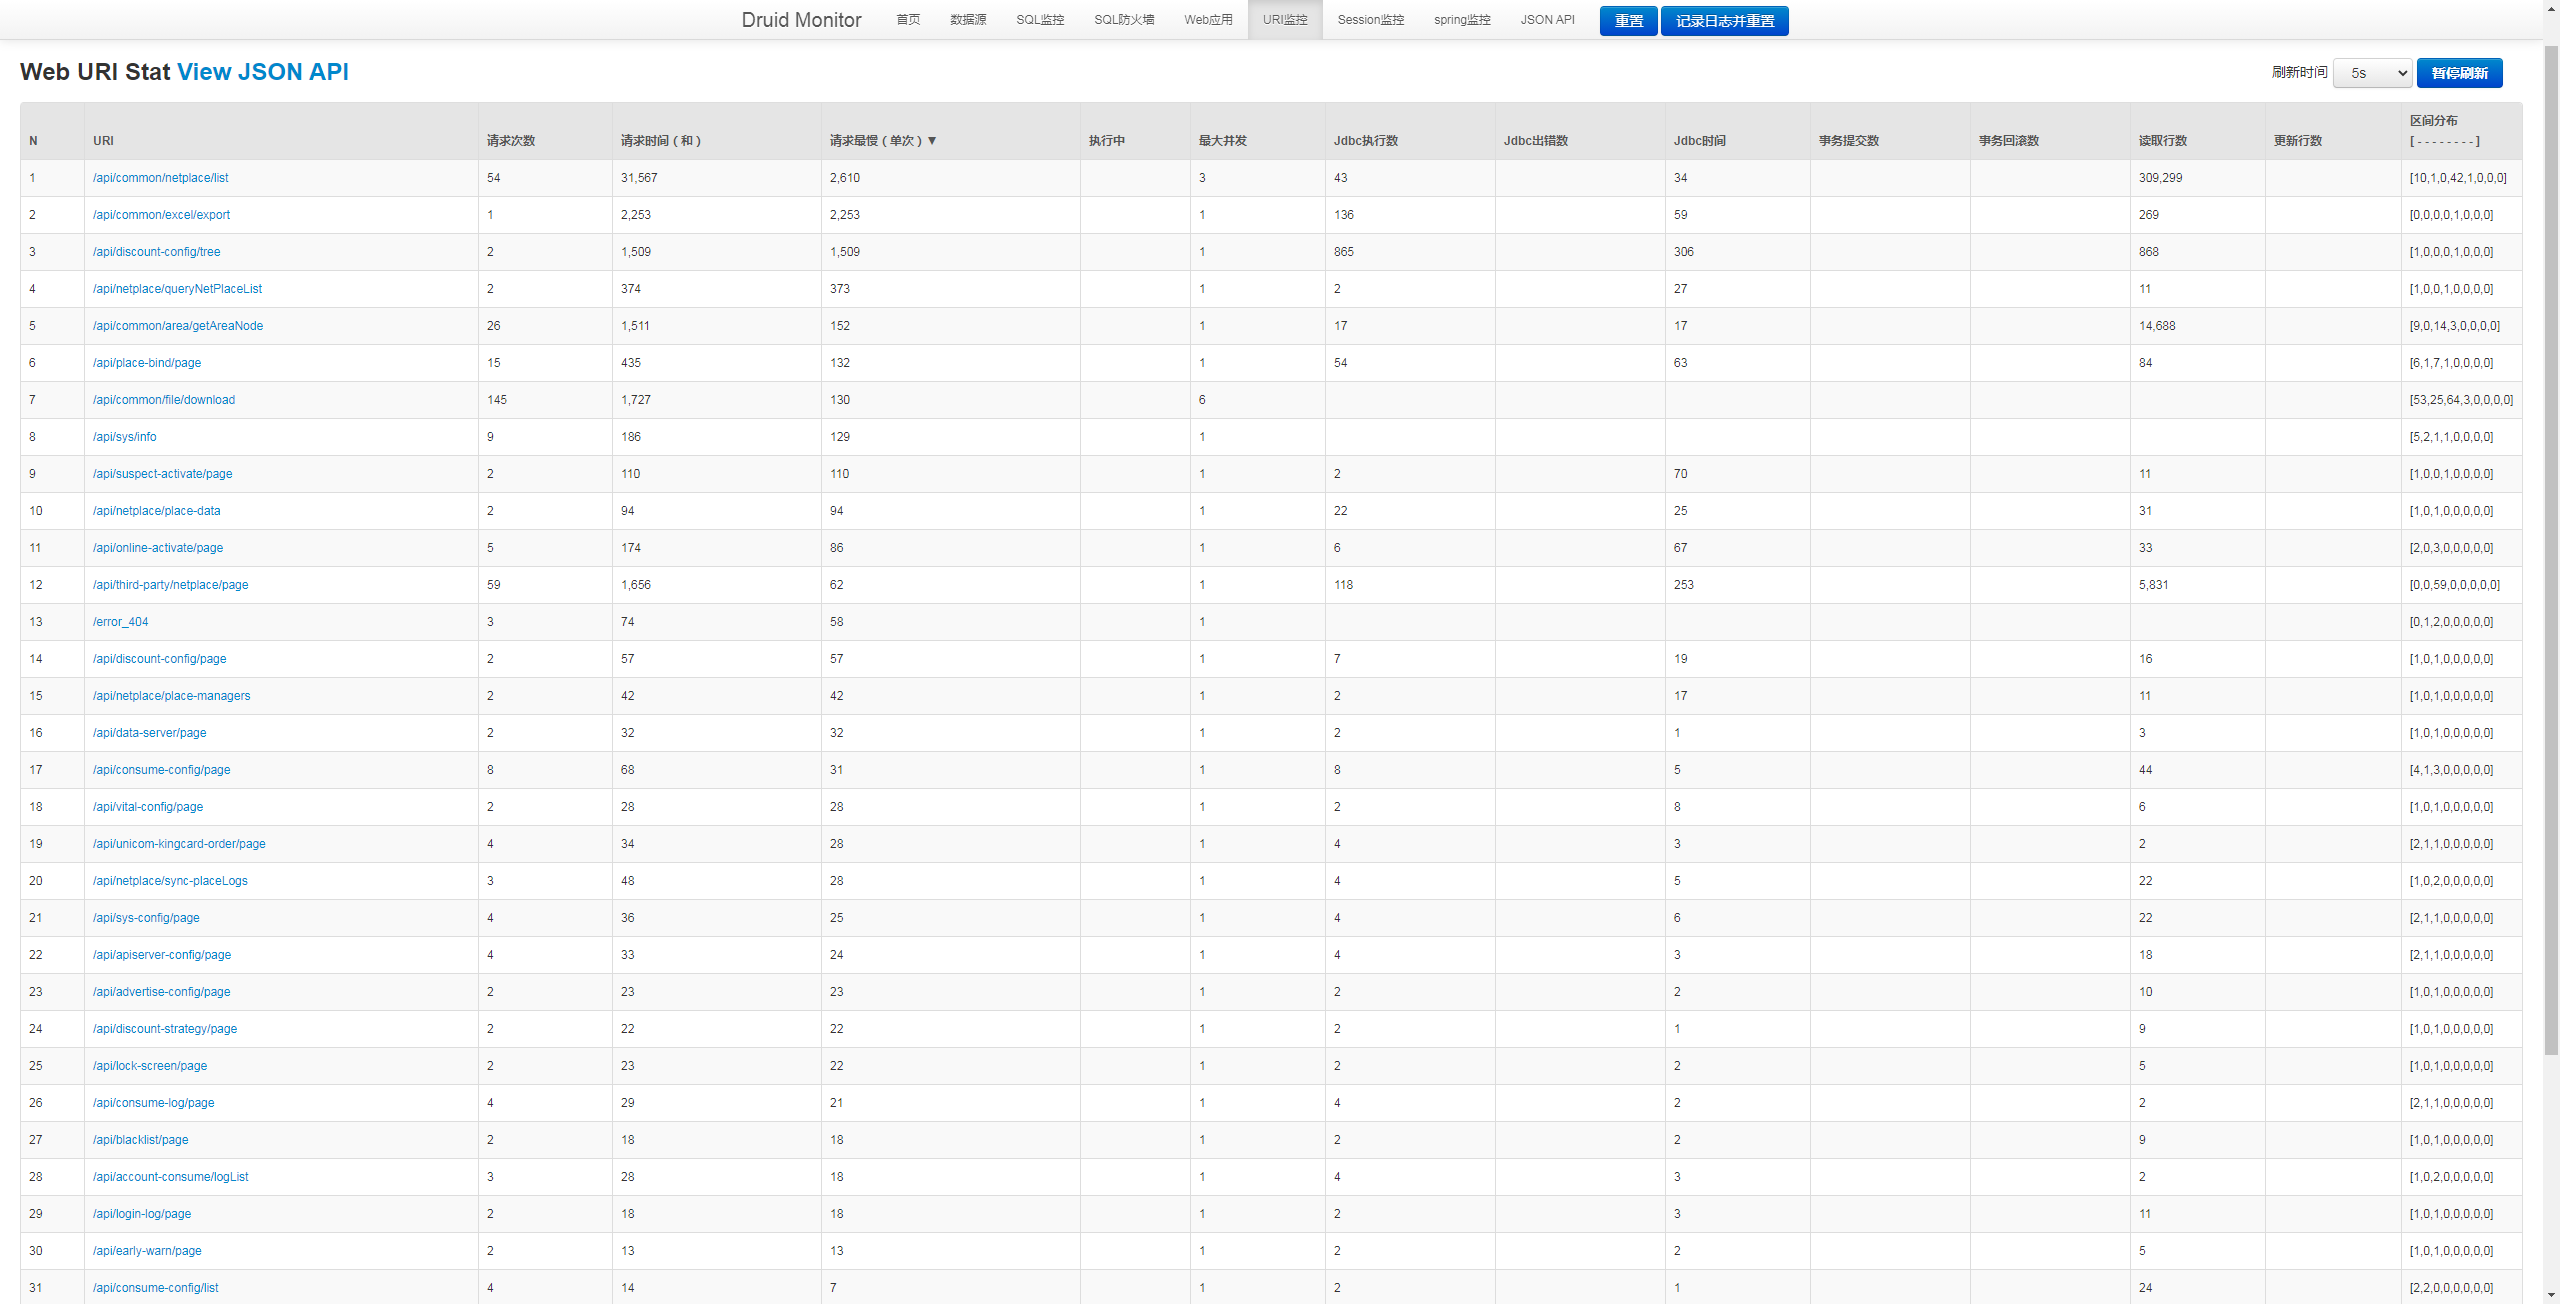
URI监控可以查看接口响应的情况:
可以对每个字段进行排序操作,要查看响应最慢的接口,倒序【请求最慢】的字段即可
其次是查看【SQL监控】
在这里查看慢SQL:
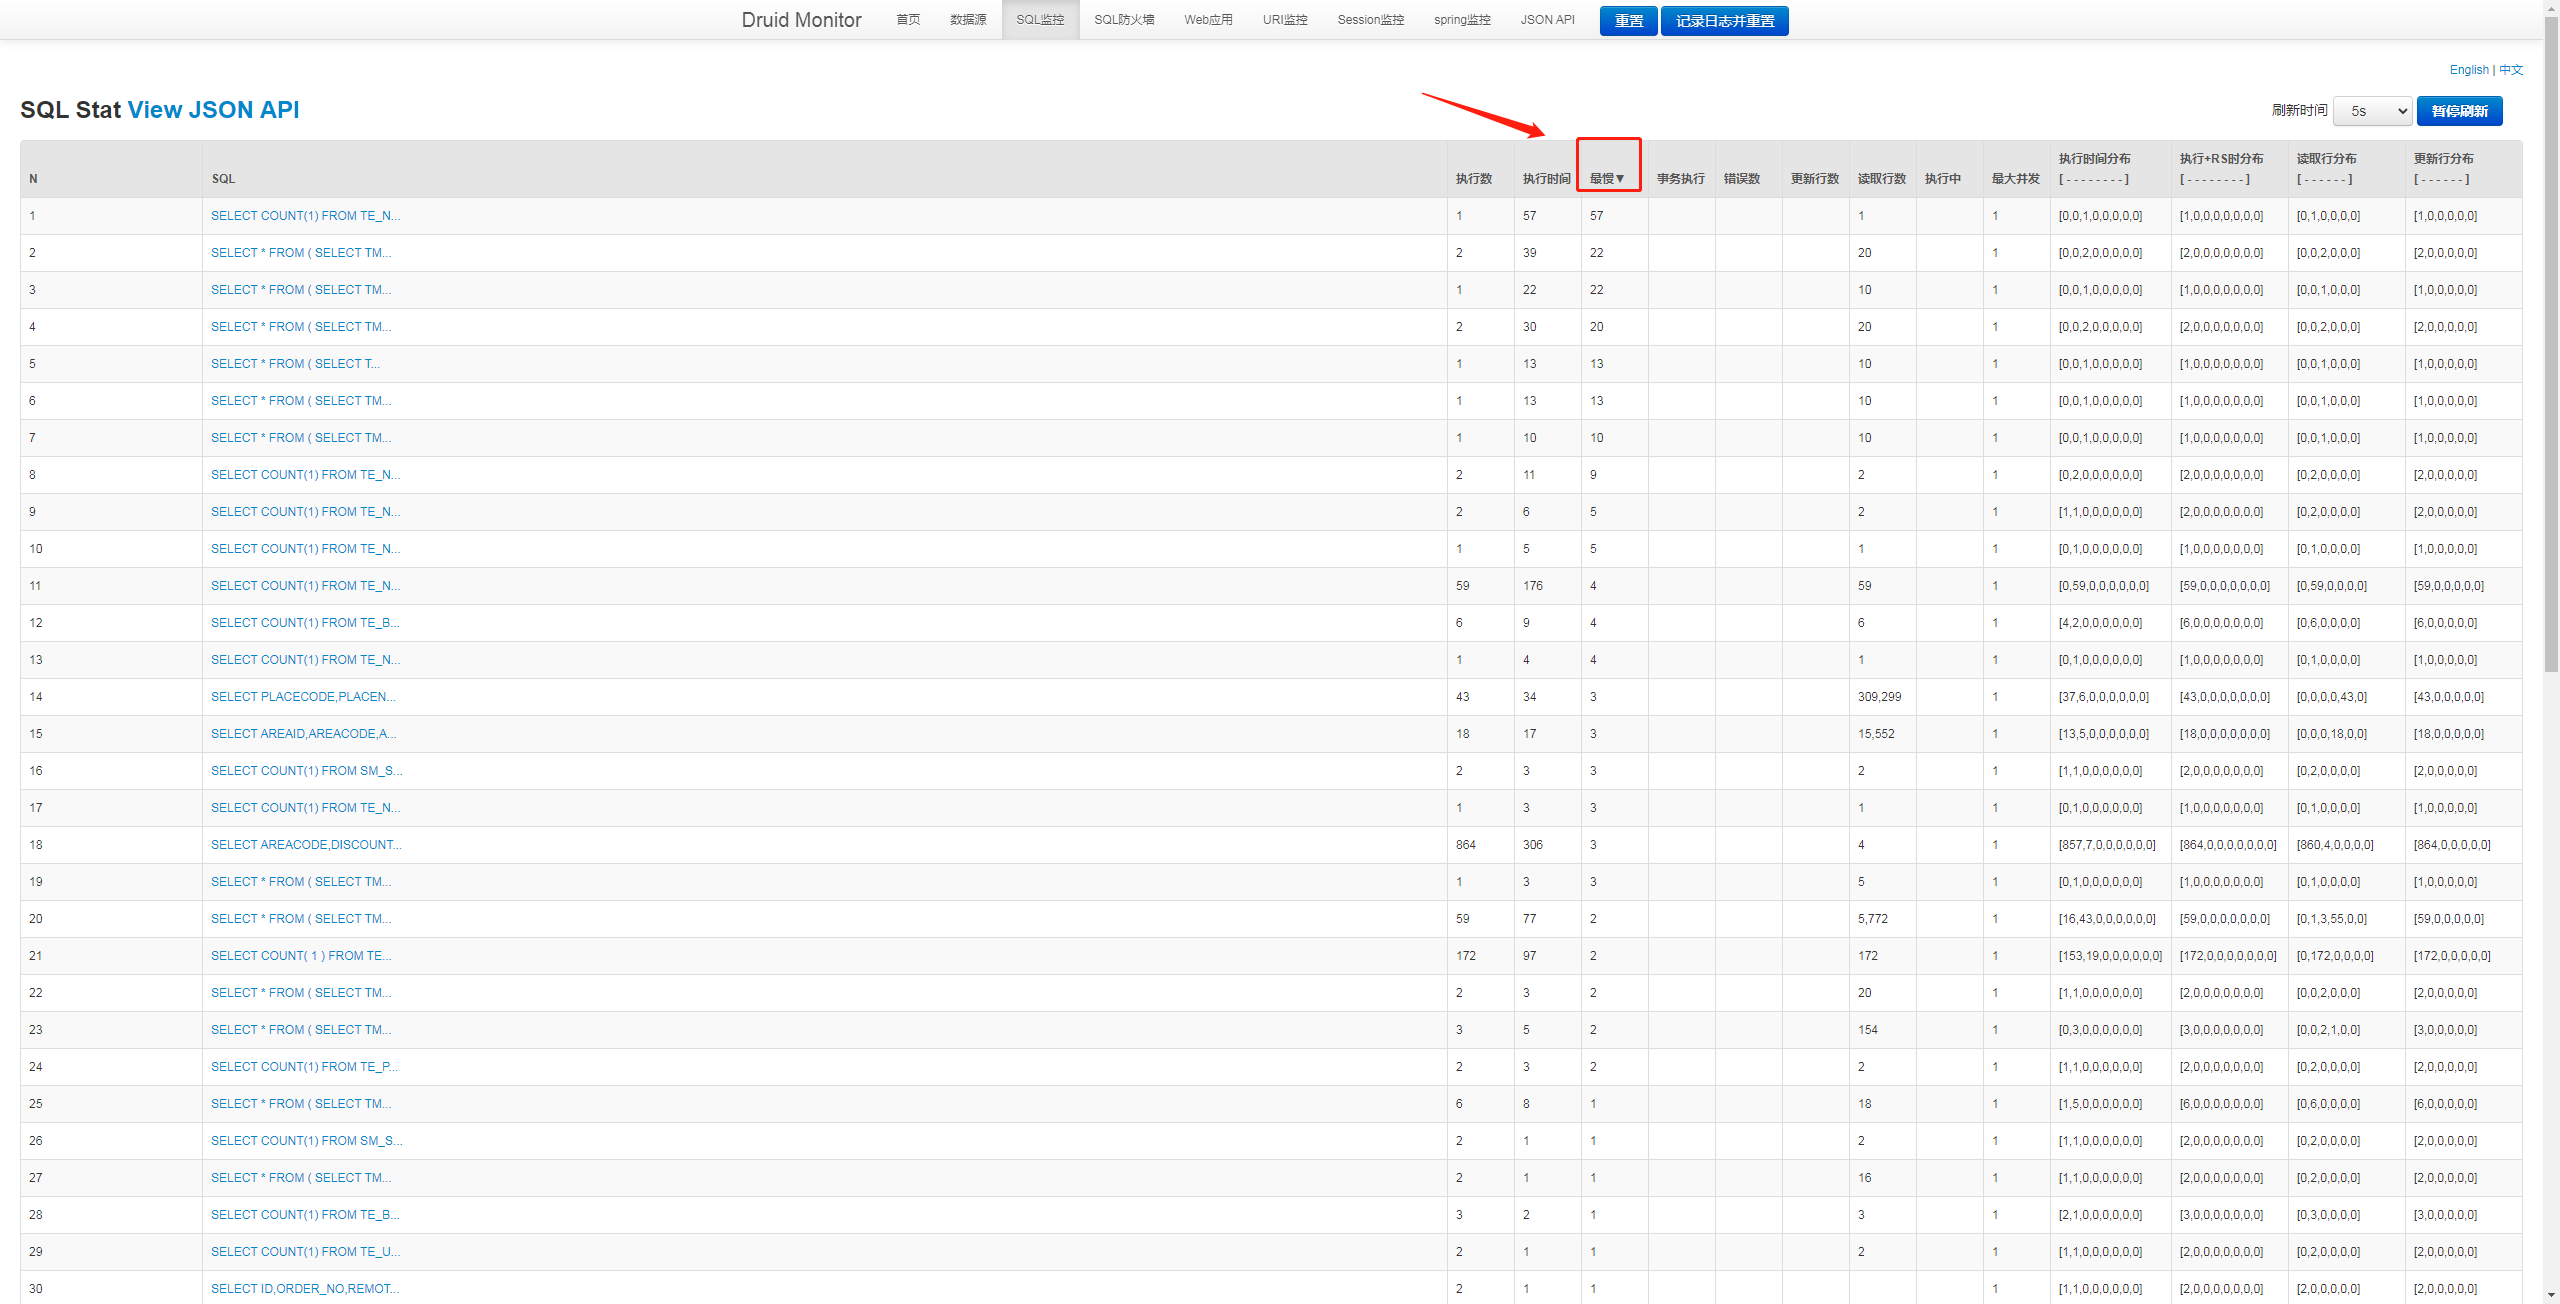
点击后可以查看SQL,但是没有参数,只有占位符

分析慢SQL的做法是看SQL执行计划:
MySQL使用Explain关键字:
mysql> EXPLAIN
SELECT *
FROM `ymcd_aisw`.`aisw_merchant`
WHERE merchant_no = 'AISW-36072521169083';
+----+-------------+---------------+------+-----------------+-----------------+---------+-------+------+-----------------------+
| id | select_type | table         | type | possible_keys   | key             | key_len | ref   | rows | Extra                 |
+----+-------------+---------------+------+-----------------+-----------------+---------+-------+------+-----------------------+
|  1 | SIMPLE      | aisw_merchant | ref  | IDX_MERCHANT_NO | IDX_MERCHANT_NO | 63      | const |    1 | Using index condition |
+----+-------------+---------------+------+-----------------+-----------------+---------+-------+------+-----------------------+
1 row in set (0.04 sec)
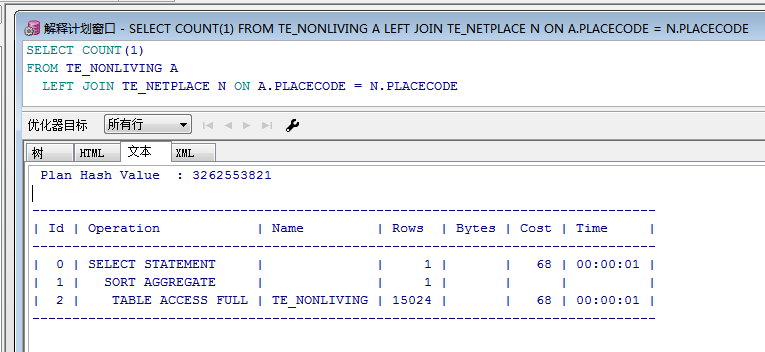
Oracle使用PL\SQL工具创建SQL执行计划:
 Plan Hash Value  : 3262553821

------------------------------------------------------------------------------
| Id | Operation            | Name         | Rows  | Bytes | Cost | Time     |
------------------------------------------------------------------------------
|  0 | SELECT STATEMENT     |              |     1 |       |   68 | 00:00:01 |
|  1 |   SORT AGGREGATE     |              |     1 |       |      |          |
|  2 |    TABLE ACCESS FULL | TE_NONLIVING | 15024 |       |   68 | 00:00:01 |
------------------------------------------------------------------------------
PostgreSQL使用关键字Explan Analyze:
postgres=# explain analyze
SELECT name FROM test WHERE id = 10000;

                                                      QUERY PLAN
-----------------------------------------------------------------------------------------------------------------------
 Gather  (cost=1000.00..107139.34 rows=1 width=11) (actual time=1.020..708.268 rows=1 loops=1)
   Workers Planned: 2
   Workers Launched: 2
   ->  Parallel Seq Scan on test  (cost=0.00..106139.24 rows=1 width=11) (actual time=449.350..683.611 rows=0 loops=3)
         Filter: (id = 10000)
         Rows Removed by Filter: 3333333
 Planning Time: 0.169 ms
 Execution Time: 708.320 ms
(8 rows)

 浙公网安备 33010602011771号