条形图和热图
1.Set up the notebook
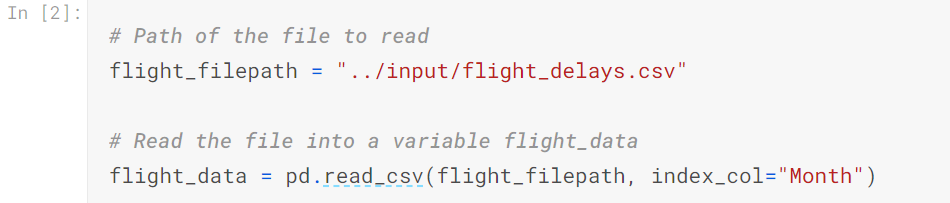
2.Load the data
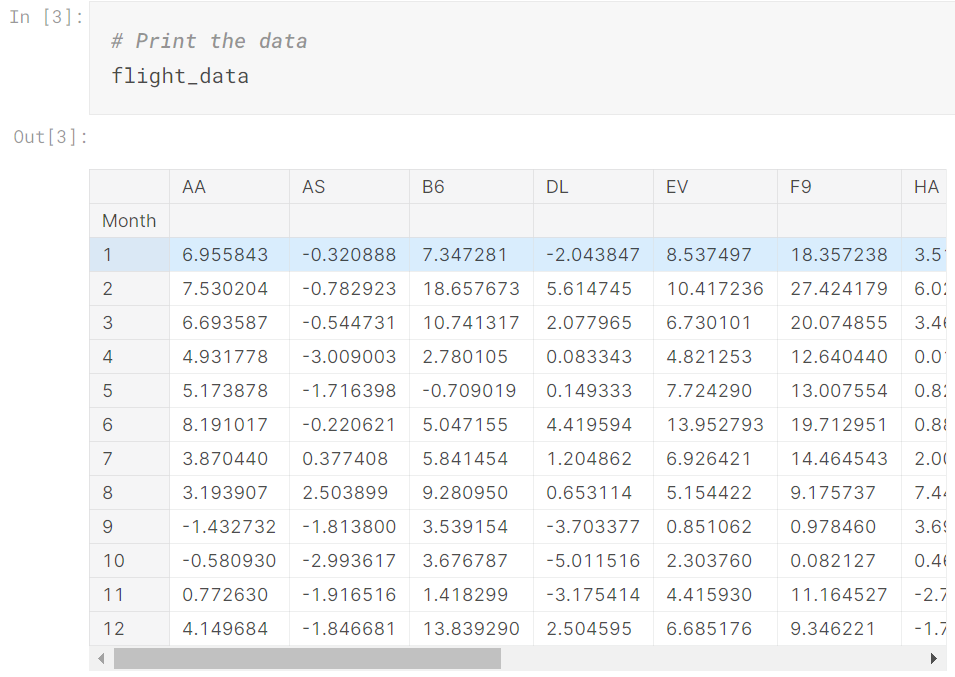
3.Examine the data
4.Bar chart
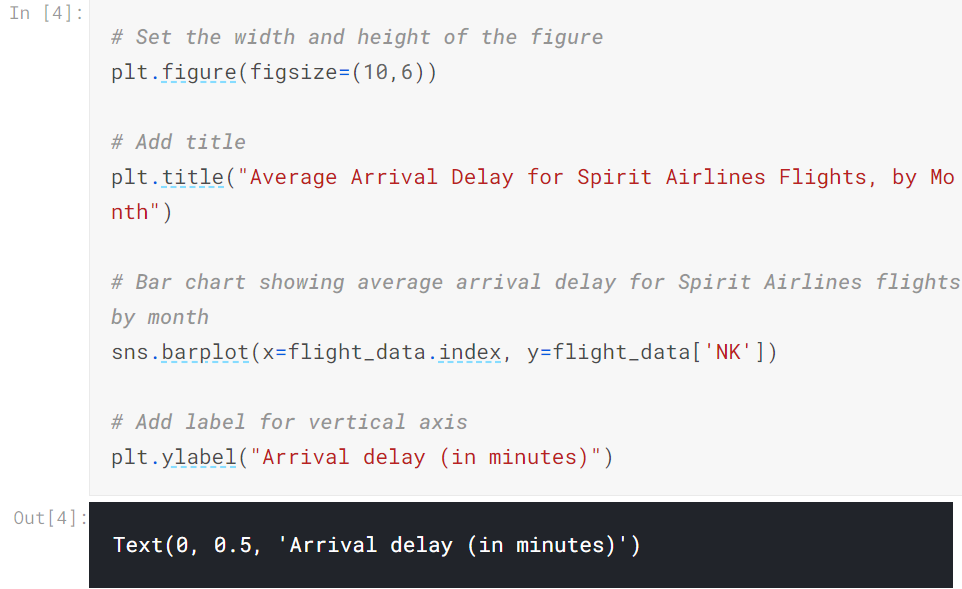
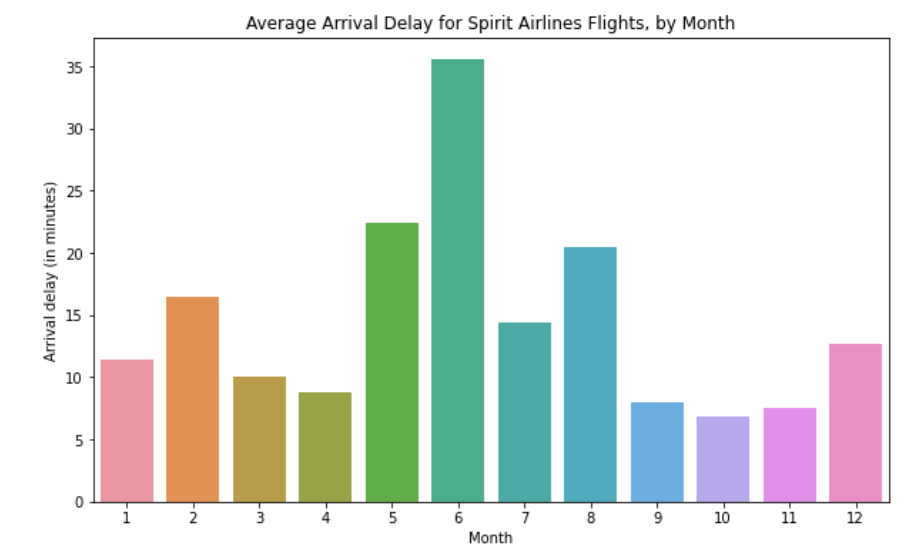
sns.barplot - This tells the notebook that we want to create a bar chart.
x=flight_data.index - This determines what to use on the horizontal axis.
y=flight_data['NK'] - This sets the column in the data that will be used to determine the height of each bar.
5.Heatmap
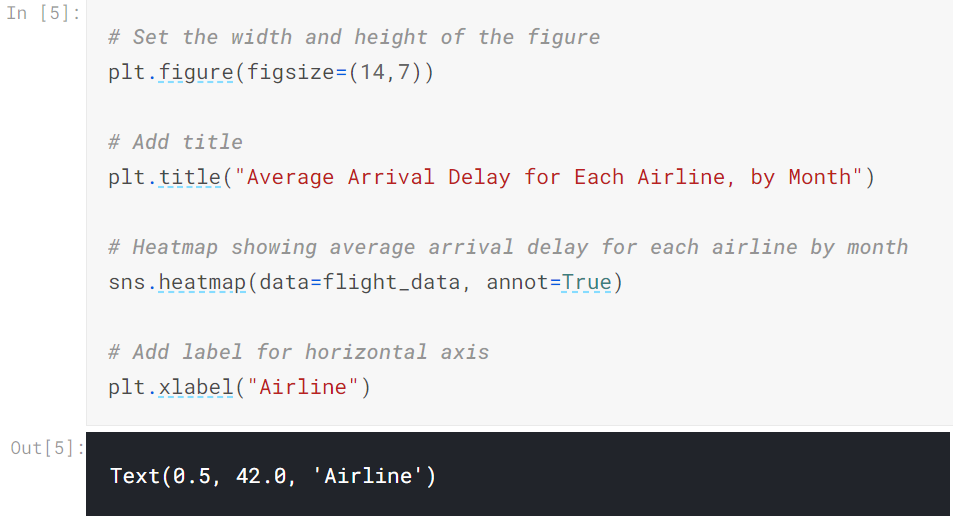
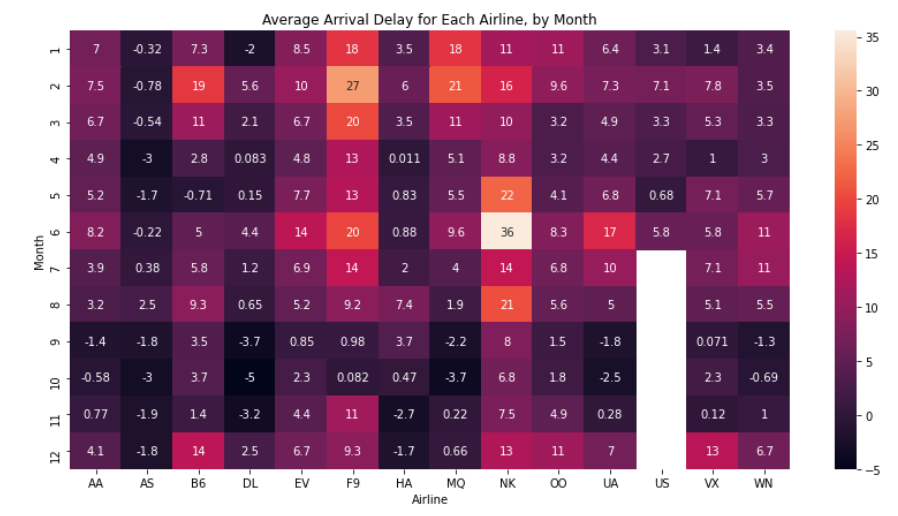
sns.heatmap - This tells the notebook that we want to create a heatmap.
data=flight_data - This tells the notebook to use all of the entries in flight_data to create the heatmap.
annot=True - This ensures that the values for each cell appear on the chart. (Leaving this out removes the numbers from each of the cells!)
posted on 2020-11-03 16:30 Mint-Tremor 阅读(107) 评论(0) 收藏 举报


 浙公网安备 33010602011771号