折线图
1.Set up the notebook

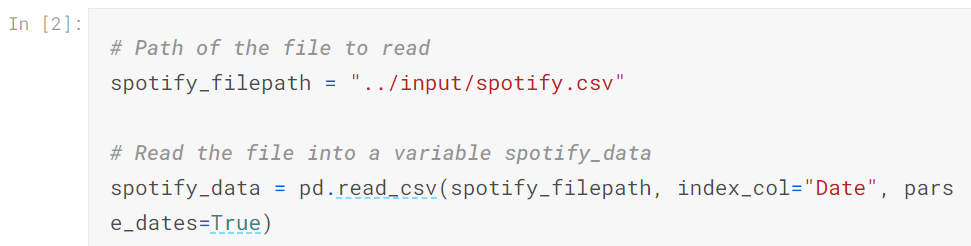
2.Load the data
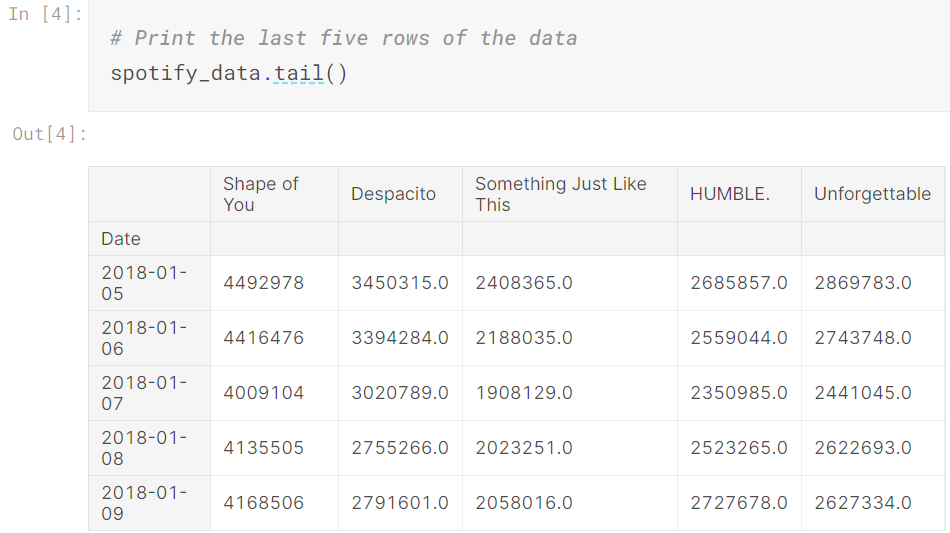
3.Examine the data

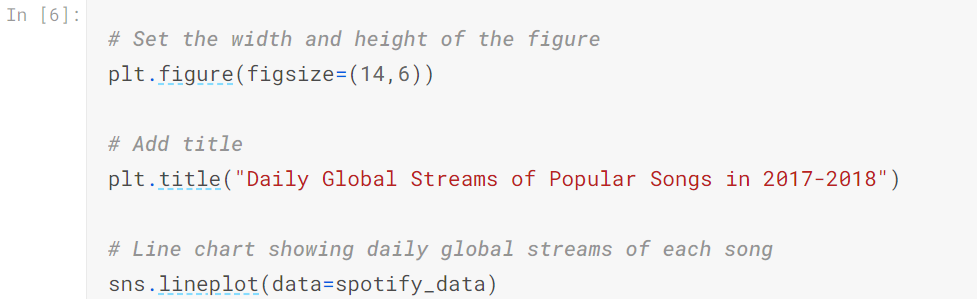
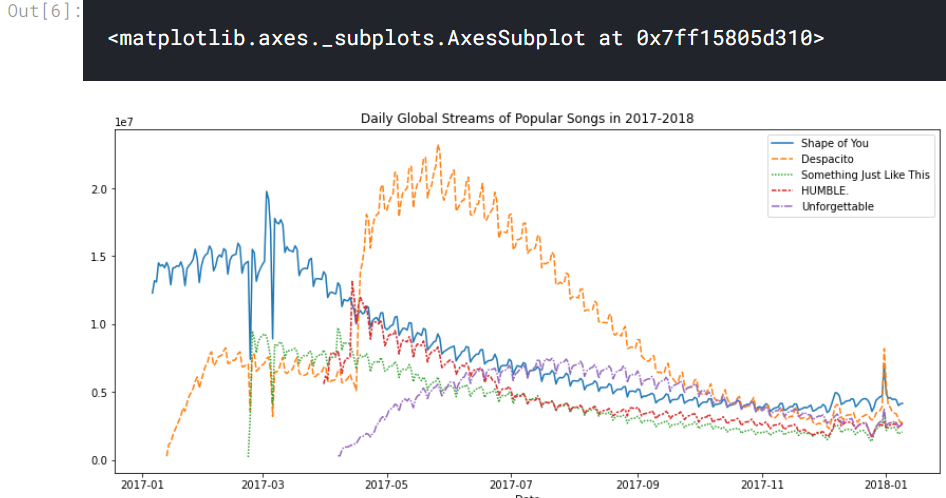
4.Plot the data
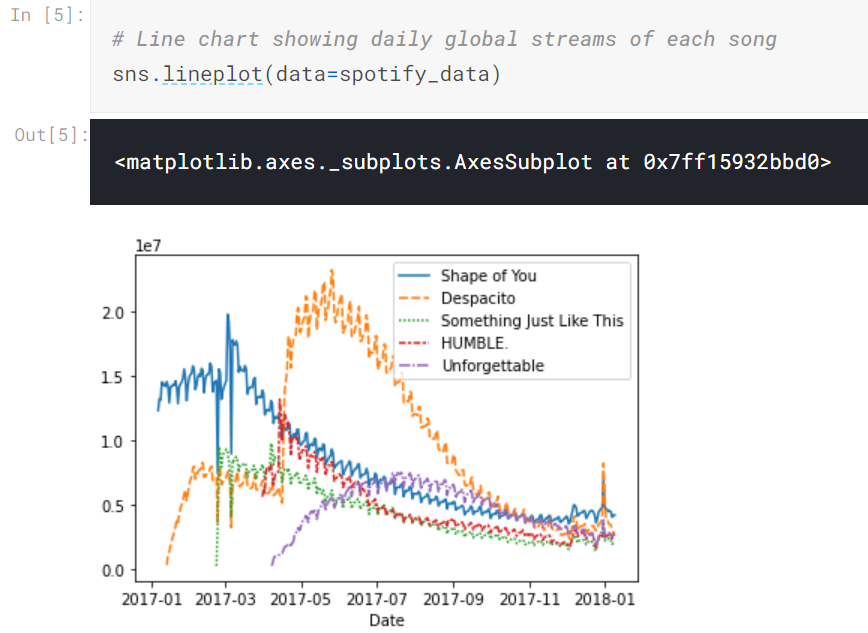
sns.lineplot tells the notebook that we want to create a line chart.
data=spotify_data selects the data that will be used to create the chart.
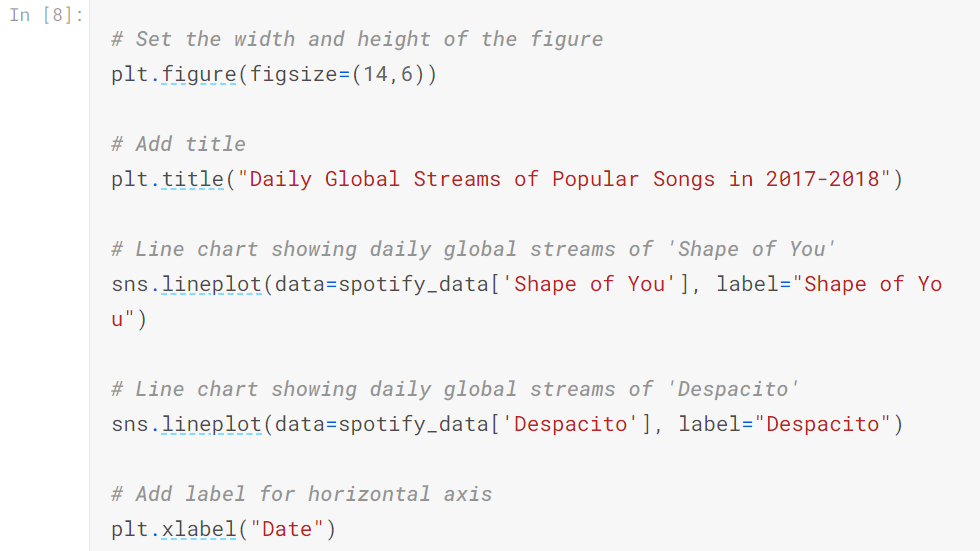
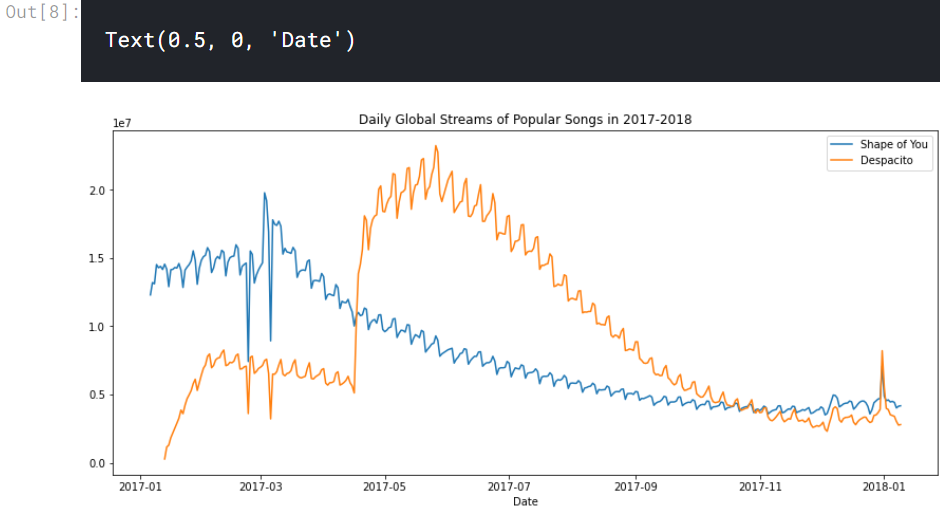
5.Plot a subset of the data

posted on 2020-11-03 16:19 Mint-Tremor 阅读(85) 评论(0) 收藏 举报


 浙公网安备 33010602011771号