图例

<template>
    <div class="highcharts-container" id="container" ref="leida" style="min-width: 400px; max-width: 660px; height: 400px; margin: 0 auto" />
</template>
<script>
    import Highcharts from 'highcharts';
    import highcharts3d from 'highcharts/highcharts-3d.js';
    import highchartsMore from 'highcharts/highcharts-more.js';//扩展图表类型

    highcharts3d(Highcharts);
    highchartsMore(Highcharts);

    export default {
        name: "Highcharts",
        props: {},
        data: () => ({
            chart: null,
            options: {},
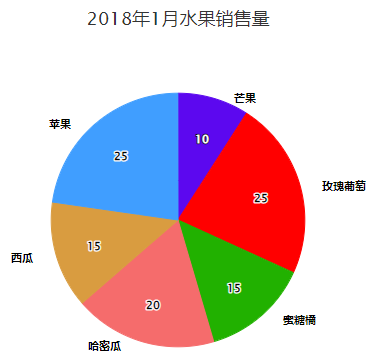
            cColor: ['#5c08ef', '#ff0000', '#21b100', '#f56c6c', '#d99c40', '#409eff', '#d4ff40'],
            labelList: [{
                    name: '芒果',
                    y: 10
            }, {
                    name: '玫瑰葡萄',
                    y: 25,
            }, {
                    name: '蜜糖橘',
                    y: 15
            }, {
                    name: '哈密瓜',
                    y: 20
            }, {
                    name: '西瓜',
                    y: 15
            }, {
                    name: '苹果',
                    y: 25
            }]
        }),
        watch: {},
        mounted() {
            this.renderChart();
        },
        methods: {
            renderChart() {
                let that = this;
                if(this.chart || !this.options) return;
                this.options = {
                    chart: {
                        plotBackgroundColor: null, // 绘图区的背景色
                        plotBorderWidth: null,
                        plotShadow: false,
                        type: 'pie'
                    },
                    colors: this.cColor,
                    title: {
                        text: '2018年1月浏览器市场份额'
                    },
                    tooltip: {
                        enabled: false,
                        pointFormat: '{series.name}: <b>{point.percentage:.1f}%</b>'
                    },
                    legend: {
                        labelFormatter: function () {
                            return this.name + ':占比'+(Math.floor(this.percentage*100)/100);
                        }
                    },
                    legend: {
                        itemStyle: {
                            cursor: "default"
                        },
                        itemHoverStyle: {
                            cursor: "default"
                        }
                    },
                    plotOptions: {
                        series: {
                            allowPointSelect: false,
                        },
                        pie: {
                            shadow: false,
                            allowPointSelect: true,
                            cursor: 'pointer',
                            borderColor: null,
                            dataLabels: {
                                connectorWidth : 0,
                                connectorPadding: 10
                            }
                        }
                    },
                    series: [
                    {
                        name: '数值',
                        size: '80%',
                        innerSize: '20%',
                        zIndex: 1,
                        enableMouseTracking: true,
                        silent: true,
                        dataLabels: {
                            inside: true,
                            formatter: function() {
                                return this.y
                            },
                            distance: -40,
                        },
                        events: {
                            click: (event) => {
                                console.log('>>>>', event);
                            }
                        },
                        data: this.labelList
                    },
                    {
                        name: '名称',
                        colorByPoint: true,
                        size: '20%',
                        zIndex: 2,
                        enableMouseTracking: false,
                        silent: true,
                        dataLabels: {
                            inside: false,
                            format: '<span>{point.name}</span>',
                            distance: 90
                        },
                        data: this.labelList
                    },
                    ]
                }
                this.chart = new Highcharts.Chart(this.$refs.leida, this.options);
            }
        },
        beforeDestroy() {
            if(this.chart !== null) {
                this.chart.destroy();
            }
        }
    };
</script>
posted on 2022-11-06 21:27  羽丫头不乖  阅读(110)  评论(0编辑  收藏  举报