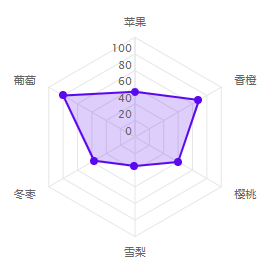
描述
1 以官网蜘蛛图为基础 https://www.highcharts.com.cn/demo/highcharts/polar-spider
2 chart.type = 'line'为线形图,chart.type = 'area' 为面积图,chart.polar = true 开启雷达图形
3 this.cColor 自定义颜色,按色组取值
4 设置提示框,不同的水果显示文本显示对应的颜色
tooltip: {
    shared: true,
    shape: 'rect',
    borderRadius: 50,
    borderWidth: 1,
    followPointer: true,
    borderColor: '#ededed',
    backgroundColor: '#ffffff',
    padding: 16,
    formatter: function () {
        var s = '';
        $.each(this.points, function (i, item) {
            item.color = that.cColor[item.point.index];
            s += '<span style="display: inline-block; color: '+that.cColor[item.point.index]+'; background-color:'+item.color+';">' + item.key + ': ' +
                item.y + '%'+'</span>';
        });
        return s;
    }
},
5 点击事件,为后续扩展
plotOptions: {
   series: {
      fillOpacity: 0.2,
      cursor: 'pointer',
      point: {
          events: {
              click: function(e) {
                  console.log('>>>>', e.point, this.category);
              }
          }
      }
  }
},
6 series.data的数据类型
数组:data: [1,2,4,5]
对象:data: [{className: 'yellow',name: '哈哈哈哈',y: 54.4},{name: '哈哈11',y: 60}...]
结果示例
<template>
    <div class="highcharts-container" id="container" ref="leida" style="min-width: 400px; max-width: 660px; height: 400px; margin: 0 auto" />
</template>

<script>
    import Highcharts from 'highcharts';
    import highcharts3d from 'highcharts/highcharts-3d.js';
    import highchartsMore from 'highcharts/highcharts-more.js';//扩展图表类型

    highcharts3d(Highcharts);
    highchartsMore(Highcharts);

    export default {
        name: "Highcharts",
        props: {},
        data: () => ({
            chart: null,
            options: {},
            cColor: ['#5c08ef', '#ff000', '#21b100', '#f56c6c', '#d99c40', '#409eff', '#d4ff40']
        }),
        watch: {},
        mounted() {
            this.renderChart();
        },
        methods: {
            renderChart() {
                let that = this;
                if(this.chart || !this.options) return;
                this.options = {
                    chart: {
                        polar: true,
                        type: 'area',
                    },
                    title: {
                        text: '水果售卖比例',
                        x: -80
                    },
                    colors: this.cColor,
                    pane: {
                        size: '60%', // 图形大小
                    },
                    xAxis: {
                        categories: ['苹果', '香橙', '樱桃', '雪梨','冬枣', '葡萄'],
                        tickmarkPlacement: 'on',
                        lineWidth: 0
                    },
                    yAxis: {
                        gridLineInterpolation: 'polygon',
                        lineWidth: 0,
                        tickInterval: 20, // 刻度间隔
                        min: 0
                    },
                    tooltip: {
                        shared: true,
                        shape: 'rect',
                        borderRadius: 50,
                        borderWidth: 1,
                        followPointer: true,
                        borderColor: '#ededed',
                        backgroundColor: '#ffffff',
                        padding: 16,
                        formatter: function () {
                            var s = '';
                            $.each(this.points, function (i, item) {
                                item.color = that.cColor[item.point.index];
                                s += '<span style="display: inline-block; color: '+that.cColor[item.point.index]+'; background-color:'+item.color+';">' + item.key + ': ' +
                                    item.y + '%'+'</span>';
                            });
                            return s;
                        }
                    },
                    legend: {
                        enabled: false,
                        align: 'right',
                        verticalAlign: 'top',
                        y: 70,
                        layout: 'vertical'
                    },
                    plotOptions: {
                        series: {
                            fillOpacity: 0.2,
                            cursor: 'pointer',
                            point: {
                                events: {
                                    click: function(e) {
                                        console.log('>>>>', e.point, this.category);
                                    }
                                }
                            }
                        }
                    },
                    series: [
                        {
                        name: '苹果',
                        data: [{
                            className: 'yellow',
                            name: '哈哈哈哈',
                            y: 54.4,
                        }, 89, 60, 35, 57, 100],
                        pointPlacement: 'on'
                    }]
                }
                this.chart = new Highcharts.Chart(this.$refs.leida, this.options);
            }
        },
        beforeDestroy() {
            if(this.chart !== null) {
                this.chart.destroy();
            }
        }
    };
</script>
<style>
/* 设置画布右下角水印 */
.highcharts-credits{
    display: none;
}
.yellow{
    color:aquamarine;
}
</style>


