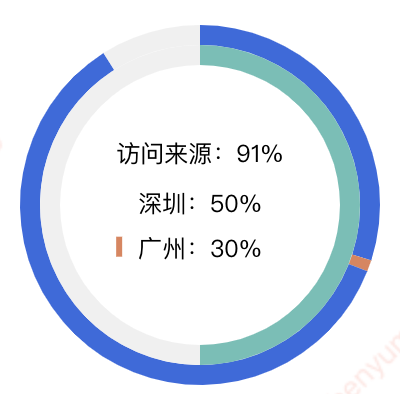
一、图例

二、知识点记录:
1、graphic实现环比图中间的文本展示
2、禁用鼠标经过环比块时高亮的效果
myChart.on('mouseover',params =>{
        myChart.dispatchAction({
        type: "downplay"
    })
});
3、环比图各个色块点击事件:click
4、画布:canvasBox
5、如若不需要点击事件,series可以直接声明三组数据,将第一组和第三组的通过重叠,设置颜色透明和z值以达到效果。
6、缩小文本:transform: scale(0.88);
三、完整代码如下:
import React, { Component } from 'react';
import echarts from 'echarts/lib/echarts';
import "echarts/lib/chart/pie";
import "echarts/lib/component/tooltip";
import "echarts/lib/component/title";
import "echarts/lib/component/graphic";
import "echarts/lib/component/legend";
import '../../stylus/charts/charts-com.less';
interface Props {
    colors?: []
}
type StateType = {
    colors: String[],
    legendArr: {}[],
    legendObj: {},
    performProgress: String,
    performProgressValue: number,
    performRate: String,
    performRateValue: number,
    timeProgress: String,
    timeProgressValue: number
}
class TwoPie extends Component<Props, StateType> {
    constructor(props) {
        super(props);
        this.state = {
            colors: this.props.colors || ['rgba(57,104,224,1)','rgba(101,192,182,1)','rgba(226,130,89,1)'],
            legendArr: [
                {name: '访问来源', value: 92},
                {name: '深圳', value: 34},
                {name: '广州', value: 97},
            ],
            legendObj: {},
            performProgress: '访问来源',
            performProgressValue: 91,
            performRate: '深圳',
            performRateValue: 50,
            timeProgress: '广州',
            timeProgressValue: 30
        }
    }
    componentWillMount() {
        // 渲染前
        console.log('Component WILL MOUNT!')
    }
    componentDidMount() {
        // 渲染后
        let undercoat = { color: 'rgba(240,240,240,1)' };
        let outLayoutData1 = [
            {
                value: 30,
                itemStyle: { color: 'rgba(57,104,224,1)' }
            },
            {
                value: 1,
                itemStyle: { color: 'rgba(226,130,89,1)' }
            },
            {
                value: 60,
                itemStyle: { color: 'rgba(57,104,224,1)' }
            },
            {
                value: 9,
                itemStyle: undercoat
            }
        ];
        let option = {
            color: this.state.colors,
            grid:{
                top: 0,
                left: 0,
                right: 0,
                bottom: 30,
                containLabel:true
            },
            graphic: [
                {                //环形图中间添加文字
                    type: 'text',            //通过不同top值可以设置上下显示
                    left: 'center',
                    top: '40%',
                    style: {
                        text: this.state.performProgress+":"+this.state.performProgressValue+"%",
                        textAlign: 'center',
                        fill: '#000',
                        height: 20,
                        fontSize: 12,
                        fontFamily: "Microsoft YaHei"
                    }
                },
                {
                    type: 'text',
                    left: 'center',
                    top: '48%',
                    style: {
                        text: this.state.performRate+":"+this.state.performRateValue+"%",
                        textAlign: 'center',
                        fill: '#000',
                        height: 20,
                        fontSize: 12
                    }
                },
                {
                    type: 'rect',
                    id: 'rect3',
                    left: '34%',
                    top: '55%',
                    shape: { width: 3, height: 10 },
                    style: {
                        fill: 'rgba(226,130,89,1)'
                    }
                },
                {
                    type: 'text',
                    left: 'center',
                    top: '55%',
                    style: {
                        text: this.state.timeProgress+":"+this.state.timeProgressValue+"%",
                        textAlign: 'center',
                        fill: '#000',
                        height: 20,
                        fontSize: 12
                    }
                }
            ],
            series: [
                {
                    name: this.state.performProgress,
                    type: 'pie',
                    clockWise: true, //顺时加载
                    hoverAnimation: false, //鼠标移入变大
                    radius: [80, 90],
                    avoidLabelOverlap: true, // 是否启用防止标签重叠策略
                    label: {
                        show: false,
                        position: 'center',
                        fontSize: 14,
                        color: "#000"
                    },
                    labelLine: {
                        show: false
                    },
                    data: outLayoutData1
                },
                {
                    name: this.state.performRate,
                    type: 'pie',
                    clockWise: true, //顺时加载
                    hoverAnimation: false, //鼠标移入变大
                    radius: [70, 80],
                    avoidLabelOverlap: true, // 是否启用防止标签重叠策略
                    label: {
                        show: true,
                        position: 'center'
                    },
                    labelLine: {
                        show: false
                    },
                    data: [
                        {
                            value: this.state.performRateValue,
                            itemStyle: { color: 'rgba(101,192,182,1)' }
                        },
                        {
                            value: Number(100 - this.state.performRateValue),
                            itemStyle: { color: 'rgba(240,240,240,1)' }
                        }
                    ]
                }
            ]
        };
        let myChart = echarts.init(document.getElementById('canvasBox'));
        myChart.setOption(option);
        window.addEventListener("resize", myChart.resize);
        myChart.on('mouseover',params =>{
            myChart.dispatchAction({
                type: "downplay"
            })
        });
        myChart.on('click',(e)=>{
            console.log('ddddddd', e,e.value);
            let item = {};
            if (e.value === 1) {
                item['name'] = this.state.timeProgress;
                item['value'] = this.state.timeProgressValue;
            } else {
                if (e.seriesIndex === 0) {
                    item['name'] = this.state.performProgress;
                    item['value'] = this.state.performProgressValue;
                } else {
                    item['name'] = e.seriesName;
                    item['value'] = e.value;
                }
            }
            console.log('获取点击值', item);

        })
    }
    render() {
        return (
            <div className="two-pie">
                <h1>两层环形图嵌套</h1>
                <div className="chart-area">
                    <div id="canvasBox" className='canvasBox'></div>
                </div>
            </div>
        );
    }
}

export default TwoPie;
附series第二式:
[
    {
      name: this.state.performProgress,
      type: 'pie',
      clockWise: true, //顺时加载
      hoverAnimation: false, //鼠标移入变大
      radius: [80, 90],
      avoidLabelOverlap: true, // 是否启用防止标签重叠策略
      labelLine: {
          show: false
      },
      data: [
          {
              value: this.state.performProgressValue,
              itemStyle: { color: 'rgba(57,104,224,1)' }
          },
          {
              value: Number(100 - this.state.performProgressValue),
              itemStyle: { color: 'rgba(240,240,240,1)' }
          }
      ]
  },
  {
      name: this.state.performRate,
      type: 'pie',
      clockWise: true, //顺时加载
      hoverAnimation: false, //鼠标移入变大
      radius: [70, 80],
      avoidLabelOverlap: true, // 是否启用防止标签重叠策略
      labelLine: {
          show: false
      },
      data: [
          {
              value: this.state.performRateValue,
              itemStyle: { color: this.state.colors[1] }
          },
          {
              value: Number(100 - this.state.performRateValue),
              itemStyle: { color: 'rgba(240,240,240,1)' }
          }
      ]
  },
  {
      name: this.state.timeProgress,
      type: 'pie',
      clockWise: true, //顺时加载
      hoverAnimation: false, //鼠标移入变大
      radius: [80, 90],
      z:3, // 相同radius,z越大越上层
      avoidLabelOverlap: true, // 是否启用防止标签重叠策略
      data: [
          {
              value: this.state.timeProgressValue,
              itemStyle: { color: 'transparent' }
          },
          {
              value: 1,
              itemStyle: { color: this.state.colors[2] }
          },
          {
              value: Number(100 - this.state.timeProgressValue - 1),
              itemStyle: { color: 'transparent' }
          }
      ]
  }
]
四、环比图中间内容实现方法二
将色块文本配置在一起,但无法单独设置文本颜色
{
    type: 'rect',
    id: 'rect0',
    left: '18%',
    top: 'middle',
    shape: { width: 3, height: 10 },
    style: {
        fill: '#3CC3B6',
        text: '  北京:20%', // 通过文本前置空格隔开与色块的间距
        textAlign: 'left',
        height: 20,
        fontSize: 12
    }
}
五、环比图中间内容实现方法三
将说明内容块通过定位position设置到画布的正中间。


