需求:折线柱状图实现,显示不同提示,颜色,标记等等。

图例:
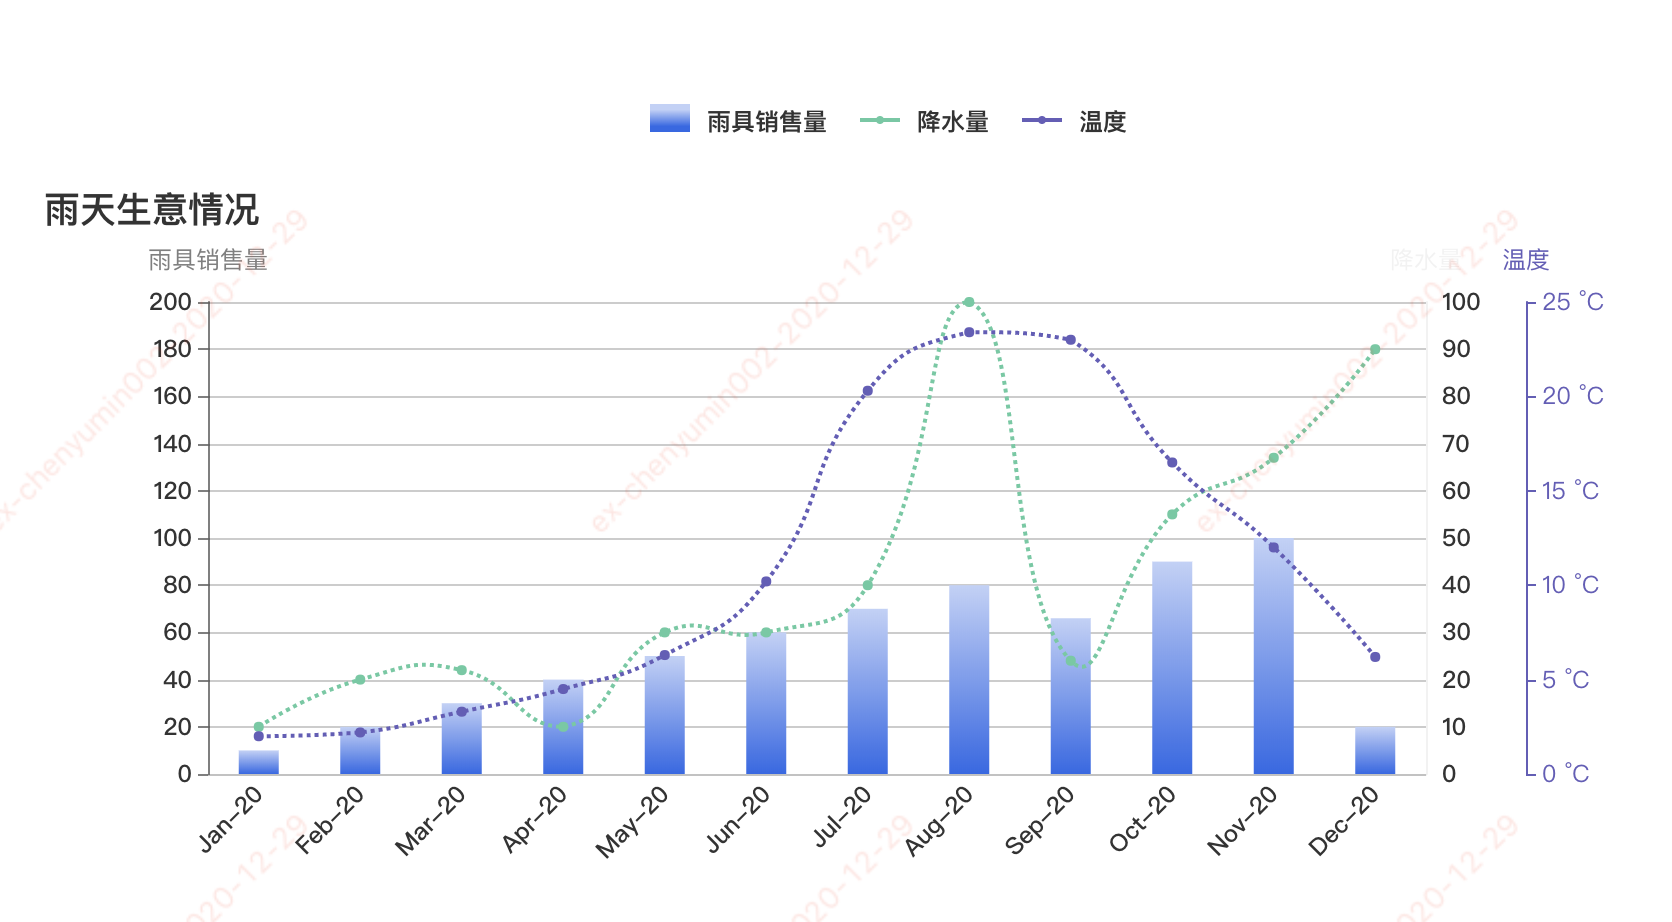
 

 实现:

<template>
    <div class="transaction-barline">
        <p class="lenged-title">
            <span class="single-lenged" v-for="(item,index) in headerNameList" :key="index">
                <span class="common" :class="item.background">
                    <span v-if="item.type == 'line'" :class="'borderFail color'+index"></span>
                </span>
                <span >{{item.name}}</span>
            </span>
        </p>
        <div class="v-chart-capital" ref="capitalBarLine"></div>
    </div>
</template>
<script>
import echarts from "echarts/lib/echarts";
// 引入柱状图组件
import "echarts/lib/chart/bar";
import "echarts/lib/chart/line";
// 引入提示框和title组件
import "echarts/lib/component/tooltip";
import "echarts/lib/component/title";
import "echarts/lib/component/legend";
require('echarts/lib/chart/custom');
export default {
    name: "transaction-barline",
    props: {
    },
    data() {
        return {
            myChart: null,
            headerNameList:[
                { name: '雨具销售量', type: 'bar', background: "transItme0" },
                { name: '降水量', type: 'line', background: "firstFail" },
                { name: '温度', type: 'line', background: "firstFail1" }
            ],
            detailData: {
                barD: {
                   name: '雨靴',
                   list: [1,2,3,4,5,6,7,8,9,10,11,12] 
                },
                lineG: {
                    name: '雨伞',
                    list: [10,20,30,40,50,60,70,80,90,10,11,12] 
                },
                lineP: {
                    name: '雨衣',
                    list: [10,20,30,40,50,60,70,80,90,10,11,12]
                }
            },
            colors: ['#C1D1F8', '#3266E8', '#5ECBA1', '#675bba'],
            monthList:[
                {
                    name: '1月',
                    english: 'Jan'
                },
                {
                    name: '2月',
                    english: 'Feb'
                },
                {
                    name: '3月',
                    english: 'Mar'
                },
                {
                    name: '4月',
                    english: 'Apr'
                },
                {
                    name: '5月',
                    english: 'May'
                },
                {
                    name: '6月',
                    english: 'Jun'
                },
                 {
                    name: '7月',
                    english: 'Jul'
                },
                {
                    name: '8月',
                    english: 'Aug'
                },
                {
                    name: '9月',
                    english: 'Sep'
                },
                {
                    name: '10月',
                    english: 'Oct'
                },
                {
                    name: '11月',
                    english: 'Nov'
                },
                {
                    name: '12月',
                    english: 'Dec'
                },
            ],
        };
    },
    mounted: function() {
        this.initChart();
    },
    created: () => {
    },
    watch: {
    },
    methods: {
        initChart() {
            this.setoption();
            window.addEventListener("resize", this.myChart.resize);
        },
        setoption() {
            let self = this;
            if (this.myChart) {
                this.myChart.dispose();
            }
            let that = this;
            this.myChart = echarts.init(this.$refs.capitalBarLine);
            let option = {
                title: {
                    text: '雨天生意情况',
                },
                tooltip: {
                    trigger: 'item',
                    axisPointer: {
                        type: 'line',
                        lineStyle: {
                            color: 'transparent'
                        }
                    },
                    formatter: (params) => {
                        let str = '';
                        let dataIndex = params.dataIndex;
                        str += "<p style='color:#333;font-weight:bold'>" + params.name.slice(0,4)+'年'+ params.name.slice(5)+'月'+"</p>";
                        if (params.seriesType === 'bar') {
                            str += "<p>"+ params.seriesName + ": " + params.value +"</p>";
                            str += "<p>"+ this.detailData.barD.name + ":" +this.detailData.barD.list[dataIndex] + "</p>";
                        }
                        if (params.seriesType === 'line') {
                            str += "<p>"+ params.seriesName + ": " + params.value +"</p>";
                            if (params.seriesIndex == 1) {
                                str += "<p>"+ this.detailData.lineG.name + ":" +this.detailData.lineG.list[dataIndex] + "</p>";
                            } else {
                                str += "<p>"+ this.detailData.lineP.name + ":" +this.detailData.lineP.list[dataIndex] + "</p>";
                            }
                        }
                        return str;
                    },
                    backgroundColor: "#fff",
                    extraCssText:
                        "padding: 12px 20px; border-radius: 5px; line-height: 20px ; text-align: left; color: #37456E; box-shadow: 0 1px 8px 0 rgba(140,152,176,0.40);border-radius: 4px;",
                    textStyle: {
                        fontSize: 12,
                        fontFamily: '"PingFangSC-Regular", "Microsoft YaHei"'
                    },
                },
                
                xAxis: [
                    {
                        type: 'category',
                        data: ['2020-01', '2020-02', '2020-03', '2020-04', '2020-05', '2020-06', '2020-07', '2020-08', '2020-09', '2020-10', '2020-11', '2020-12'],
                        axisTick: {
                            show: false,
                        },
                        splitLine: {
                            show: false
                        },
                        axisLine: {
                            show: true,
                            lineStyle: {
                                color: 'rgba(0,0,0,0.05)'
                            }
                        },
                        axisLabel: {
                            textStyle: {
                                color: "#333",
                            },
                            rotate: 45,
                            fontSize: 12,
                            fontFamily: '"PingFangSC-Medium", "Microsoft YaHei"',
                            formatter: (val) => {
                                return this.dataDute(val);
                            } 
                        },
                    }
                ],
                grid: {
                    right: '20%'
                },
                yAxis: [
                    {
                        type: 'value',
                        name: '雨具销售量',
                        min: 0,
                        max: 200,
                        interval: 20,
                        axisTick: {
                            show: true
                        },
                        axisLine: {
                            show: true,
                            lineStyle: {
                                color: 'rgba(0,0,0,0.5)'
                            }
                        },
                        textStyle: {
                            color: "#7d889f"
                        },
                        splitLine: {
                            show: true
                        },
                        axisLabel: {
                            // show: false,
                            show: true,
                            formatter: (value, index) => {
                                // console.log(value, 'value');
                                return value;
                            },
                            textStyle: {
                                color: "#333",
                            },
                            fontFamily: '"PingFangSC-Medium", "Microsoft YaHei"'
                        }
                    },
                    {
                        type: 'value',
                        name: '降水量',
                        min: 0,
                        max: 100,
                        interval: 10,
                        axisLabel: {
                            show: true,
                            formatter: '{value} ml'
                        },
                        axisTick: {
                            show: false
                        },
                        axisLine: {
                            show: true,
                            lineStyle: {
                                color: 'rgba(0,0,0,0.05)'
                            }
                        },
                        splitLine: {
                            show: false,
                            lineStyle: {
                                type: 'dashed',
                                color: 'rgba(0,0,0,0.05)'
                            }
                        },
                        axisLabel: {
                            // show: true,
                            textStyle: {
                                color: "#333",
                            },
                            fontFamily: '"PingFangSC-Medium", "Microsoft YaHei"'
                        },
                        fontFamily: '"PingFangSC-Medium", "Microsoft YaHei"'
                    },
                    {
                        type: 'value',
                        name: '温度',
                        min: 0,
                        max: 25,
                        interval: 5,
                        offset: 50,
                        axisLine: {
                            lineStyle: {
                                color: '#675bba'
                            }
                        },
                        axisLabel: {
                            formatter: '{value} °C'
                        }
                    }
                ],
                
                series: [
                    {
                        name: '雨具销售量',
                        type: 'bar',
                        legendHoverLink: false,
                        barWidth: 20,
                        itemStyle: {
                            color:  new echarts.graphic.LinearGradient(0, 0, 0, 1, [{
                                offset: 0,
                                color: this.colors[0]
                            }, {
                                offset: 1,
                                color: this.colors[1]
                            }])
                        },
                        label: {
                            show: false,
                            color: '#333',
                            position: 'top',
                            fontFamily: '"PingFangSC-Regular", "Microsoft YaHei"',
                        },
                        data: [10,20,30,40,50,60,70,80,66,90,100,20]
                    },
                    {
                        name: '降水量',
                        type: 'line',
                        symbol: 'circle',
                        symbolSize: 5,
                        smooth: true,
                        legendHoverLink: false,
                        lineStyle: {
                            type: 'dotted',
                            color: this.colors[2],
                            width: 2
                        },
                        itemStyle: {
                            color: this.colors[2]
                        },
                        yAxisIndex: 1,
                        data: [10,20,22,10,30,30,40,100,24,55,67,90]
                    },
                    {
                        name: '平均温度',
                        type: 'line',
                        symbol: 'circle',
                        symbolSize: 5,
                        smooth: true,
                        legendHoverLink: false,
                        lineStyle: {
                            type: 'dotted',
                            color: this.colors[3],
                            width: 2
                        },
                        itemStyle: {
                            color: this.colors[3]
                        },
                        yAxisIndex: 2,
                        data: [2.0, 2.2, 3.3, 4.5, 6.3, 10.2, 20.3, 23.4, 23.0, 16.5, 12.0, 6.2]
                    }
                ]
            }
            this.myChart.setOption(option);
        },

        getInitData() {
            let inputData = {
                headerNameList:[
                    { name: '雨具销售量', background: "transItme0" },
                    { name: '降水量', background: "firstFail" },
                    { name: '温度', background: "firstFail1" }
                ],
                xAxisData: ['2020-01', '2020-02', '2020-03', '2020-04', '2020-05', '2020-06', '2020-07', '2020-08', '2020-09', '2020-10', '2020-11', '2020-12'],
                yAxisData: [
                    {
                        name: '雨具销售量',
                        list: [10,20,30,40,50,60,70,80,66,90,100,20],
                        type: 'bar',
                        color: '#333'
                    }
                ]
            };
        },
        dataDute(value) {
            let str = '';
            let df = value.split('-')[0],
            dy = df.substr(2),
            monthDay = value.split('-')[1],
            deMonth = 0;
            if(monthDay.substr(0,1) === '0') {
                deMonth = monthDay.substr(1,1);
            } else {
               deMonth =  monthDay;
            }
            
            let monthDays = deMonth+'月';
            this.monthList.forEach((item, index) => {
                if(item.name === monthDays) {
                    str = item.english + '-'+dy;
                }
            })
            return str;
        },
        
    }
};
</script>

<style lang="less" scoped>
.transaction-barline{
    position: relative;
    height: 100%;
    .v-chart-capital {
        height: 356px;
    }
    
    .lenged-title {
        width: 100%;
        position: relative;
        top: 80%;
        margin: 20px 0;
        text-align: center;
        box-sizing: border-box;
        font-size: 12px;
        color: #333333;
        font-weight: bold;
        .single-lenged {
            display: inline-block;
            height: 20px;
            line-height: 20px;
            margin-right: 16px;
        }
        .common {
            display: inline-block;
            height: 0;
            position: relative;
            top: 1px;
            margin-right: 5px;
            height: 14px;
            width: 20px;
            .borderFail{
                width: 4px;
                height: 4px;
                border-radius: 50%;
                position: absolute;
                bottom: -3px;
                left: 8px;
                // background: #5ECAA1;
            }
            .color1{
                background: #5ECAA1;
            }
            .color2{
                background: #675bba;
            }
        }
        .single-lenged:hover {
            cursor: pointer;
        }
        .transItme0{
            background: -ms-linear-gradient(270deg, #C1D1F8 0%, #C1D1F8 20%, #3266E8 80%,#3266E8 100%);
            background: -webkit-linear-gradient(270deg, #C1D1F8 0%, #C1D1F8 20%, #3266E8 80%,#3266E8 100%);
            background: -o-linear-gradient(270deg, #C1D1F8 0%, #C1D1F8 20%, #3266E8 80%,#3266E8 100%);
        }
        .transItme1{
            background: #5ECAA1;
        }
        .firstFail{
            position: relative;
            top: -4px;
            border-bottom: 2px solid  #5ECAA1;
        }
        .firstFail1{
            position: relative;
            top: -4px;
            border-bottom: 2px solid #675bba;
        }
    }
}

</style>


posted on 2020-12-29 10:32  羽丫头不乖  阅读(264)  评论(0编辑  收藏  举报