python第二章例题及作业3035
例2.2.2
a=[]
with open('data2_2.txt') as f:
    for (i, s) in enumerate(f):
        a.append([s.count('a'), s.count('c'),
        s. count('g'), s. count('t')])
b=np. array(a);print(b)

例2.2
a=[]
with open('data2_2.txt') as f:
    for (i, s) in enumerate(f):
        a.append([s.count('a'), s.count('c'),
        s. count('g'), s. count('t')])
b=np. array(a);print(b)

例2.3
print(L)
print(L[0])
L[0]='a'
L[1:3]=['b','Hello']
print(L)
L[2:4]=[]
print(L)

例2.4
d=[c for b in a for c in b]
print(d)

例2.5
fn=[filename for filename in
    os. listdir('D:\Programs\Python\Python37')
    if filename.endswith(('.exe','.py'))]
print(fn)import os
fn=[filename for filename in
    os. listdir('D:\Programs\Python\Python37')
    if filename.endswith(('.exe','.py'))]
print(fn)```

```from numpy. random import randint
import numpy as np
a=randint(10,20,16)
ma=max(a)
ind1=[index for index,value in enumerate(a) if value==ma]
ind2=np.where(a==ma)
print(ind1);print(ind2[0])

例2.6
print(T)
print(T[-1])
print(T[1:3])

例2.7
print(student)
a = set('abcdabe')
print(a)

例2.8
print(dict1['Alice'])
dict1['new']='Hello'
dict1['Alice']='1234'
dict2={'abe': 123,456:78.9}
print(dict2[456])
例2.9
print(Dict['age'])
print(Dict. get('age'))
print(Dict. get('address', 'Not Exists.'))
print(Dict['address'])

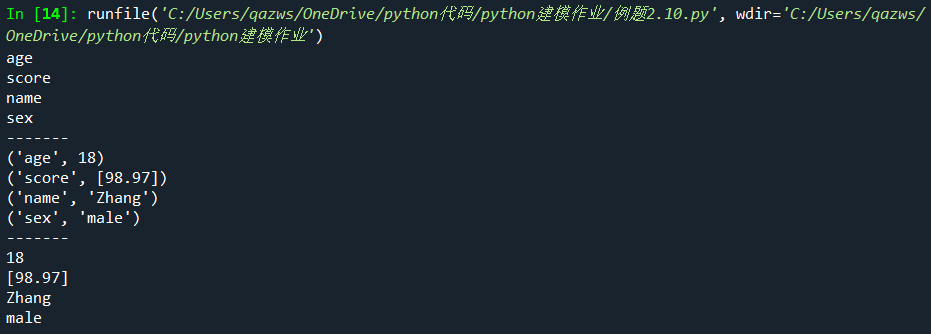
例2.10
for item in Dict:
    print(item)
print("-------")
for item in Dict. items():
    print(item)
print("-------")
for value in Dict. values():
    print(value)
例2.11
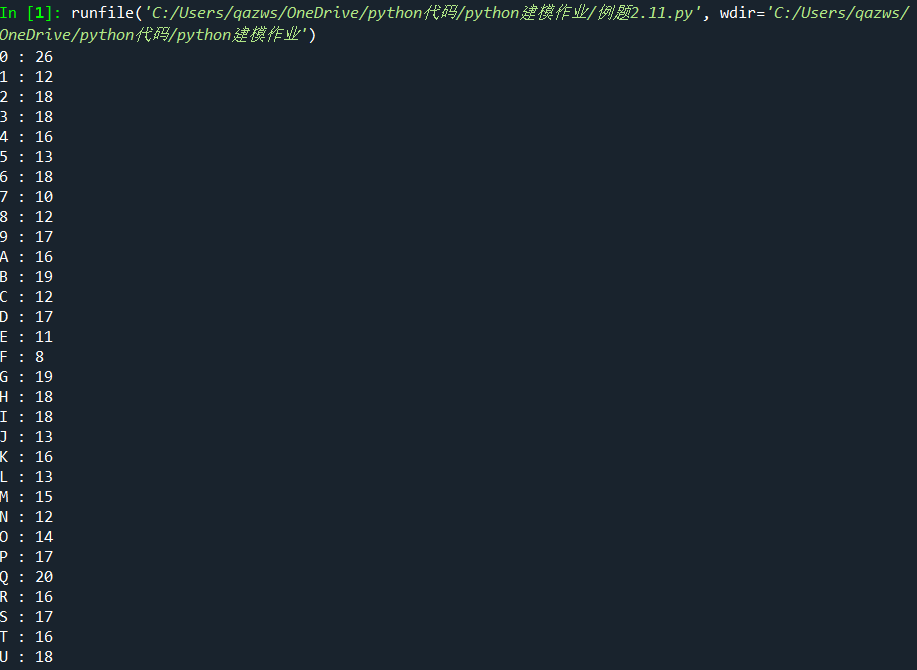
import random
x=string.ascii_letters+string.digits
y=''.join([random.choice(x) for i in range(1000)])
d=dict()
for ch in y:
    d[ch]=d.get(ch,0)+1;
for k,v in sorted(d.items()):
    print(k,':',v)
例2.12
    r = 1
    while n > 1:
        r *= n
        n -= 1
    return r
def fib(n):
    a, b = 1, 1
    while a < n:
        print(a, end='  ')
        a, b = b, a+b
        print('%d!=%d'%(5,factorial(5)))
        fib(200)
例2.13
    return [[x for x in L if fn(x)],
            [x for x in L if not fn(x)]]
s=bifurcate_by(['beep', 'boop', 'foo', 'bar'], lambda x: x[0] == 'b')
print(s)

例2.14
L=lambda x: [x**2, x**3, x**4]
print(f(3,4,5)); print(L(2))

例2.15
import random
import numpy.random as nr
a=math.gcd(12,21)
b=random.randint(0,2)
c=nr.randint(0,2,(4,3))
print(a); print(b); print(c)

例2.16
from numpy.random import randint
a=sample(range(10),5)
b=randint(0,10,5)
print(a); print(b)

例2.17
a=sin(3)
b=pi
c=e
d=radians(180)
print(a); print(b); print(c); print(d)

例2.18
print(factorial(6))
fib(300)
例2.19
x1=list(range(9,21))
nr.shuffle(x1)
x2=sorted(x1)
x3=sorted(x1,reverse=True)
x4=sorted(x1,key=lambda item:len(str(item)))
print(x1); print(x2); print(x3); print(x4)

例2.20
x2=list(enumerate(x1))
for ind,ch in enumerate(x1): print(ch)

例2.21
x=random.randint(1e5,1e8)
y=list(map(int,str(x)))
z=list(map(lambda x,y: x%2==1 and y%2==0, [1,3,2,4,1],[3,2,1,2]))
print(x); print(y); print(z)

例2.22
b = filter(lambda x: x.isalnum(),['abc', 'xy12', '***'])
print(list(a)); print(list(b))

例2.23
    return [item for item in L if L.count(item) == 1]
a=filter_non_unique([1, 2, 2, 3, 4, 4, 5])
print(a)

例2.24
s2=list(zip('abcd',range(4)))
print(s1); print(s2)

例2.25
a1 = np.array([1, 2, 3, 4])
a2 = a1.astype(float)
a3 = np.array([1, 2, 3, 4], dtype=float)
print(a1.dtype); print(a2.dtype); print(a3.dtype)
b = np.array([[1, 2, 3], [4, 5, 6]])
c = np.arange(1,5)
d = np.linspace(1, 4, 4)
e = np.logspace(1, 3, 3, base=2)

例2.26
a = np.ones(4, dtype=int)
b = np.ones((4,), dtype=int)
c= np.ones((4,1))
d = np.zeros(4)
e = np.empty(3)
f = np.eye(3)
g = np.eye(3, k=1)
h = np.zeros_like(a)
例2.27
a = np.arange(16).reshape(4,4)
b = a[1][2]
c = a[1, 2]
d = a[1:2, 2:3]
x = np.array([0, 1, 2, 1])
print(a[x==1])

例2.28
a = np.arange(16).reshape(4,4)
b = np.floor(5*np.random.random((2, 4)))
c = np.ceil(6*np.random.random((4, 2)))
d = np.vstack([a, b])
e = np.hstack([a, c])
例2.29
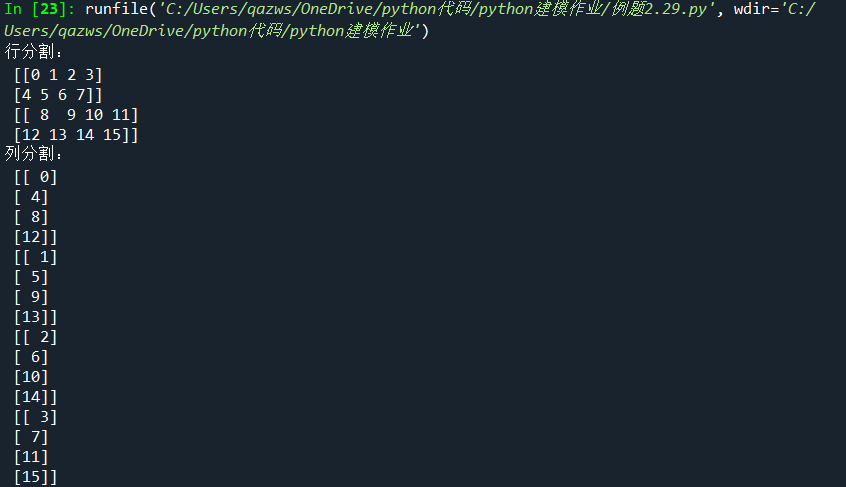
a = np.arange(16).reshape(4,4)
b = np.vsplit(a, 2)
print('行分割:\n', b[0], '\n', b[1])
c = np.hsplit(a, 4)
print('列分割:\n', c[0], '\n', c[1], '\n', c[2], '\n', c[3])
例2.30
a = np.array([[0, 3, 4],
             [1, 6, 4]])
b = a.sum()
c1 = sum(a)
c2 = np.sum(a, axis=0)
c3 = np.sum(a, axis=0, keepdims=True)
print(c2.shape, c3.shape)

例2.31
a = np.array([[0, 3, 4],
             [1, 6, 4]])
b = np.array([[1, 2, 3],
              [2, 1, 4]])
c = a / b
d = np.array([2, 3, 2])
e = a * d
f = np.array([[3],[2]])
g = a * f
h = a ** (1/2)
例2.32
a = np.ones(4)
b = np.arange(2, 10, 2)
c = a @ b
d = np.arange(16).reshape(4,4)
f = a @ d
g = d @ a
例2.33
a = np.array([[0, 3, 4],
             [1, 6, 4]])
b = np.linalg.norm(a, axis=1)
c = np.linalg.norm(a, axis=0)
d = np.linalg.norm(a)
print('行向量2范数为:', np.round(b, 4))
print('列向量2范数为:', np.round(c, 4))
print('矩阵2范数为:', round(d, 4))

例2.34
a = np.array([[3, 1], [1, 2]])
b = np.array([9, 8])
x1 = np.linalg.inv(a) @ b
x2 = np.linalg.solve(a, b)
print(x1); print(x2)

例2.35
a = np.array([[3, 1], [1, 2], [1, 1]])
b = np.array([9, 8, 6])
x = np.linalg.pinv(a) @ b
print(np.round(x, 4))

例2.36
a = np.eye(4)
b = np.rot90(a)
c, d = np.linalg.eig(b)
print('特征值为:', c)
print('特征向量为:\n', d)

例2.37
import numpy as np
dates=pd.date_range(start='20191101',end='20191124',freq='D')
a1=pd.DataFrame(np.random.randn(24,4), index=dates, columns=list('ABCD'))
a2=pd.DataFrame(np.random.rand(24,4))
例2.38(1)
import numpy as np
dates=pd.date_range(start='20191101', end='20191124', freq='D')
a1=pd.DataFrame(np.random.randn(24,4), index=dates, columns=list('ABCD'))
a2=pd.DataFrame(np.random.randn(24,4))
a1.to_excel('data2_38_1.xlsx')
a2.to_csv('data2_38_2.csv')
f=pd.ExcelWriter('data2_38_3.xlsx')
a1.to_excel(f,"Sheet1")
a2.to_excel(f,"Sheet2")
f.save()
例2.38(2)
import numpy as np
dates=pd.date_range(start='20191101',  end='20191124',  freq='D')
a1=pd.DataFrame(np.random.randn(24,4), index=dates, columns=list('ABCD'))
a2=pd.DataFrame(np.random.randn(24,4))
a1.to_excel('data2_38_4.xlsx', index=False)
a2.to_csv('data2_38_5.csv', index=False)
f=pd.ExcelWriter('data2_38_6.xlsx')
a1.to_excel(f,"Sheet1", index=False)
a2.to_excel(f,"Sheet2", index=False)
f.save()
例2.39
a=pd.read_csv("data2_38_2.csv", usecols=range(1,5))
b=pd.read_excel("data2_38_3.xlsx", "Sheet2", usecols=range(1,5))
例2.40
import numpy as np
d=pd.DataFrame(np.random.randint(1,6,(10,4)), columns=list("ABCD"))
d1=d[:4]
d2=d[4:]
dd=pd.concat([d1,d2])
s1=d.groupby('A').mean()
s2=d.groupby('A').apply(sum)

例2.41
import numpy as np
a = pd.DataFrame(np.random.randint(1,6,(5,3)),
                 index=['a', 'b', 'c', 'd', 'e'],
                 columns=['one', 'two', 'three'])
a.loc['a', 'one'] = np.nan
b = a.iloc[1:3, 0:2].values
a['four'] = 'bar'
a2 = a.reindex(['a', 'b', 'c', 'd', 'e', 'f'])
a3 = a2.dropna()
例2.42
    L1=[]; L2=[];
    for line in fp:
        L1.append(len(line))
        L2.append(len(line.strip()))
data = [str(num)+'\t' for num in L2]
print(L1); print(L2)
with open('data2_42.txt', 'w') as fp2:
    fp2.writelines(data)

习题2.1
import pandas as pd
import sympy as sp
sp.init_printing(use_unicode=True)
import matplotlib.pyplot as plt
plt.rcParams['font.sans-serif']=['Times New Roman + SimSun + WFM Sans SC']
plt.rcParams['mathtext.fontset']='cm'
plt.rcParams['axes.unicode_minus']=False
plt.rcParams['figure.dpi'] = 200
plt.rcParams['xtick.direction'] = 'in'
plt.rcParams['ytick.direction'] = 'in'
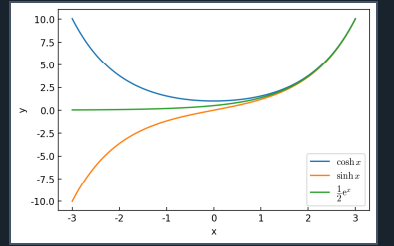
x = np.linspace(-3, 3, 100)
y1 = np.cosh(x)
y2 = np.sinh(x)
y3 = np.exp(x)/2
plt.xlabel('x')
plt.ylabel('y')
plt.plot(x, y1, label= r'$\cosh x$')
plt.plot(x, y2, label= r'$\sinh x$')
plt.plot(x, y3, label= r'${\dfrac {1} {2} {\rm e}^x}$')
plt.legend()
plt.show()
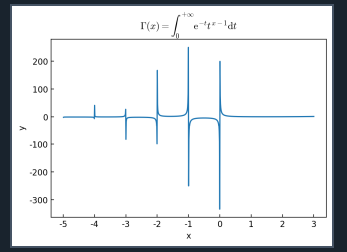
习题2.2
import pandas as pd
import sympy as sp
sp.init_printing(use_unicode=True)
import matplotlib.pyplot as plt
plt.rcParams['font.sans-serif']=['Times New Roman + SimSun + WFM Sans SC']
plt.rcParams['mathtext.fontset']='cm'
plt.rcParams['axes.unicode_minus']=False
plt.rcParams['figure.dpi'] = 200
plt.rcParams['xtick.direction'] = 'in'
plt.rcParams['ytick.direction'] = 'in'
from scipy.special import gamma
x = np.linspace(-5, 3, 1000)
y = gamma(x)
plt.xlabel('x')
plt.ylabel('y')
plt.title(r'$\Gamma(x)=\int_0^{+\infty}{\rm e}^{-t}t^{x-1}{\rm d}t$')
plt.plot(x, y)
plt.show()
习题2.3
import pandas as pd
import sympy as sp
sp.init_printing(use_unicode=True)
import matplotlib.pyplot as plt
plt.rcParams['font.sans-serif']=['Times New Roman + SimSun + WFM Sans SC']
plt.rcParams['mathtext.fontset']='cm'
plt.rcParams['axes.unicode_minus']=False
plt.rcParams['figure.dpi'] = 200
plt.rcParams['xtick.direction'] = 'in'
plt.rcParams['ytick.direction'] = 'in'
x = np.linspace(-5, 5, 50)
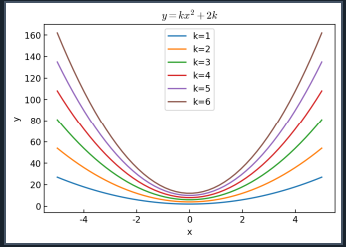
fx = lambda x, k: k*x**2 + 2*k
plt.xlabel('x')
plt.ylabel('y')
plt.title(r'$y=kx^2+2k$')
for k in range(1, 7):
    plt.plot(x, fx(x, k), label=f'{k=}')
plt.legend()
plt.show()
习题2.4
import pandas as pd
import sympy as sp
sp.init_printing(use_unicode=True)
import matplotlib.pyplot as plt
plt.rcParams['font.sans-serif']=['Times New Roman + SimSun + WFM Sans SC']
plt.rcParams['mathtext.fontset']='cm'
plt.rcParams['axes.unicode_minus']=False
plt.rcParams['figure.dpi'] = 200
plt.rcParams['xtick.direction'] = 'in'
plt.rcParams['ytick.direction'] = 'in'
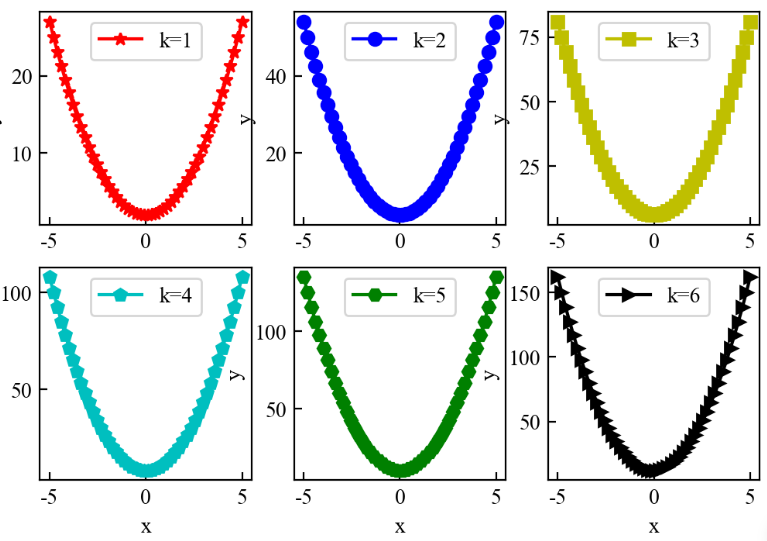
s=['*r-','ob-','sy-','pc-','Hg-','>k-']
for i in range(1, 7):
    plt.subplot(2, 3, i)
    plt.xlabel('x')
    plt.ylabel('y')
    plt.plot(x, fx(x, i), s[i-1], label=f'k={i}')
    plt.legend()
    plt.show()
习题2.5
import pandas as pd
import sympy as sp
sp.init_printing(use_unicode=True)
import matplotlib.pyplot as plt
plt.rcParams['font.sans-serif']=['Times New Roman + SimSun + WFM Sans SC']
plt.rcParams['mathtext.fontset']='cm'
plt.rcParams['axes.unicode_minus']=False
plt.rcParams['figure.dpi'] = 200
plt.rcParams['xtick.direction'] = 'in'
plt.rcParams['ytick.direction'] = 'in'
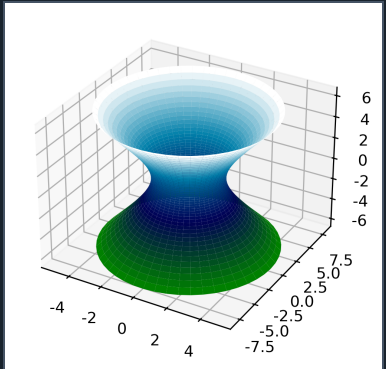
u = np.linspace(0,2*np.pi,50)
v = np.linspace(-np.pi/2,np.pi/2,50)
u, v = np.meshgrid(u, v)
x = 2*np.cosh(v)*np.cos(u)
y = np.sqrt(10)*np.cosh(v)*np.sin(u)
z = 2*np.sqrt(2)*np.sinh(v)
fig = plt.figure(dpi=300)
ax = fig.add_subplot(projection='3d')
ax.plot_surface(x, y, z, cmap='ocean')
习题2.6
import pandas as pd
import sympy as sp
sp.init_printing(use_unicode=True)
import matplotlib.pyplot as plt
plt.rcParams['font.sans-serif']=['Times New Roman + SimSun + WFM Sans SC']
plt.rcParams['mathtext.fontset']='cm'

plt.rcParams['axes.unicode_minus']=False
plt.rcParams['figure.dpi'] = 200

plt.rcParams['xtick.direction'] = 'in'
plt.rcParams['ytick.direction'] = 'in'
from numpy.linalg import norm

a = pd.read_excel('C:/Users/qazws/OneDrive/python代码/danan/《Python数学建模算法与应用》程序和数据/02第2章  Python使用入门/附件1:区域高程数据.xlsx', header=None, nrows=874)
b = a.values
[m, n]=b.shape
x0 = np.arange(m)*50
y0 = np.arange(n)*50;
s = 0
for i in np.arange(m-1):
    for j in np.arange(n-1):
        p1 = np.array([x0[i], y0[i], b[i, j]])
        p2 = np.array([x0[i+1],y0[j],b[i+1,j]])
        p3 = np.array([x0[i+1],y0[j+1],b[i+1,j+1]])
        p4 = np.array([x0[i],y0[j+1],b[i,j+1]])
        p12 = norm(p1-p2); p23 = norm(p3-p2); p13 = norm(p3-p1)
        p14 = norm(p4-p1); p34 = norm(p4-p3)
        L1 = (p12+p23+p13)/2;s1 = np.sqrt(L1*(L1-p12)*(L1-p23)*(L1-p13))
        L2 = (p13+p14+p34)/2; s2 = np.sqrt(L2*(L2-p13)*(L2-p14)*(L2-p34))
        s = s+s1+s2
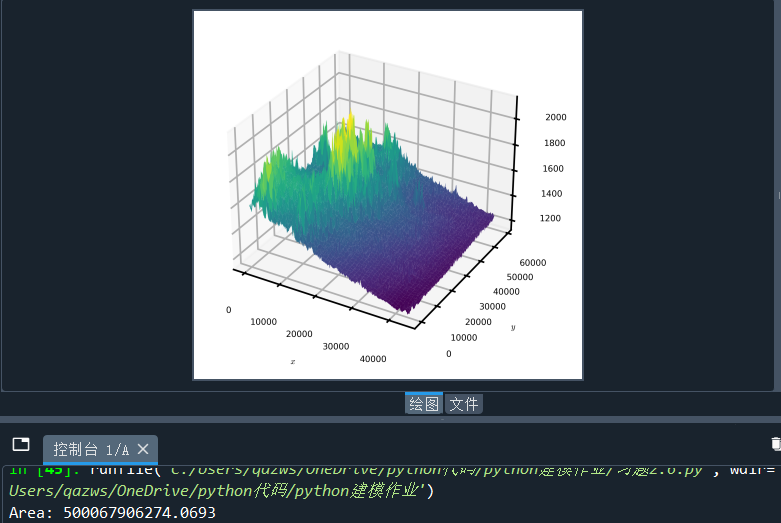
print("Area:", s)
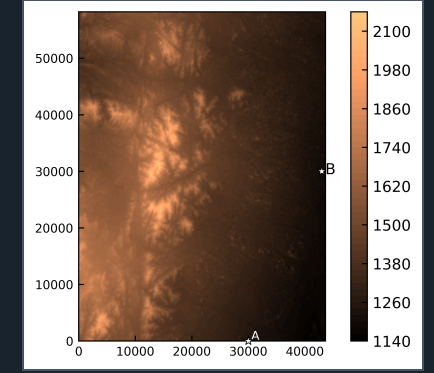
fig = plt.figure(dpi=800)
ax = fig.add_subplot(121, projection='3d')
X, Y = np.meshgrid(x0, y0)
ax.plot_surface(X, Y, b.T, cmap='viridis')
ax.set_xlabel('$x$', fontsize=4, labelpad=0.01)
ax.set_ylabel('$y$', fontsize=4, labelpad=0.01)
ax.set_zlabel('$z$', fontsize=4, labelpad=0.01)
ax.tick_params(which='major', labelsize=4)
fig = plt.figure(dpi=800)
ax = fig.add_subplot(111)
a = ax.contourf(x0, y0, b.T, 50, cmap='copper')
ax.tick_params(which='major', labelsize=8)
ax.set_aspect(1)
fig.colorbar(a, ax=ax)
ax.plot(30000, 0, marker='*', markerfacecolor='w', markeredgecolor='k', markersize=6, markeredgewidth=0.5, clip_on=False, zorder=10)
ax.text(30500, 200, 'A', color='w', fontsize=8)
ax.plot(43000, 30000, marker='*', markerfacecolor='w', markeredgecolor='k', markersize=6, markeredgewidth=0.5, clip_on=False, zorder=10)
ax.text(43600, 29500, 'B')
ax.xaxis.set_clip_on(False)
fig.show()
习题2.7
import pandas as pd
import sympy as sp
sp.init_printing(use_unicode=True)
import matplotlib.pyplot as plt
plt.rcParams['font.sans-serif']=['Times New Roman + SimSun + WFM Sans SC']
plt.rcParams['mathtext.fontset']='cm'

plt.rcParams['axes.unicode_minus']=False
plt.rcParams['figure.dpi'] = 200

plt.rcParams['xtick.direction'] = 'in'
plt.rcParams['ytick.direction'] = 'in'
from scipy.optimize import root
fx = lambda x: [
    4*x[0] + 2*x[1] - x[2] - 2,
    3*x[0] - x[1] + 2*x[2] - 10,
    11*x[0] + 3*x[1] - 8
]
root(fx, [0, 0, 0])
A = np.array([[4, 2, -1], [3, -1, 2], [11, 3, 0]])
b = np.array([[2], [10], [8]])
Ab = np.hstack([A, b])
r1 = np.linalg.matrix_rank(A)
r2 = np.linalg.matrix_rank(Ab)
print(f'{r1 = }, {r2 = }')
x = np.linalg.pinv(A)@b
np.round(x, 4)
from scipy.optimize import least_squares
f = lambda x: [
    2*x[0] + 3*x[1] + 1*x[2],
    1*x[0] - 2*x[1] + 4*x[2],
    3*x[0] + 8*x[1] - 2*x[2],
    4*x[0] - 1*x[1] + 9*x[2]
]
least_squares(f, [1, 2, 3])

习题2.8
import pandas as pd
import sympy as sp
sp.init_printing(use_unicode=True)
import matplotlib.pyplot as plt
plt.rcParams['font.sans-serif']=['Times New Roman + SimSun + WFM Sans SC']
plt.rcParams['mathtext.fontset']='cm'
plt.rcParams['axes.unicode_minus']=False
plt.rcParams['figure.dpi'] = 200
plt.rcParams['xtick.direction'] = 'in'
plt.rcParams['ytick.direction'] = 'in'
from scipy.optimize import root
def fx(x):
    ret = []
    ret.append(4*x[0] + x[1] - 1)
    for i in range(1, 999):
        ret.append(x[i-1] + 4*x[i] + x[i+1] - i - 1)
    ret.append(x[998] + 4*x[999] - 1000)
    return ret
root(fx, np.random.randn(1000))
A = 4*np.eye(1000) + np.eye(1000, k=-1) + np.eye(1000, k=1)
np.linalg.inv(A)@np.arange(1, 1001).reshape(1000, 1)
习题2.9
import pandas as pd
import sympy as sp
sp.init_printing(use_unicode=True)
import matplotlib.pyplot as plt
plt.rcParams['font.sans-serif']=['Times New Roman + SimSun + WFM Sans SC']
plt.rcParams['mathtext.fontset']='cm'

plt.rcParams['axes.unicode_minus']=False
plt.rcParams['figure.dpi'] = 200

plt.rcParams['xtick.direction'] = 'in'
plt.rcParams['ytick.direction'] = 'in'
x, y = sp.var('x y')
f = [x**2 - y - x - 3, x + 3*y - 2]
sp.solve(f, [x, y])
from scipy.optimize import fsolve
f = lambda x: [x[0]**2 - x[1] - x[0] - 3, x[0] + 3*x[1] - 2]
print(fsolve(f, [0, 0]), fsolve(f, [2, 0]), sep='\n')

习题2.10
import pandas as pd
import sympy as sp
sp.init_printing(use_unicode=True)
import matplotlib.pyplot as plt
plt.rcParams['font.sans-serif']=['Times New Roman + SimSun + WFM Sans SC']
plt.rcParams['mathtext.fontset']='cm'

plt.rcParams['axes.unicode_minus']=False
plt.rcParams['figure.dpi'] = 200

plt.rcParams['xtick.direction'] = 'in'
plt.rcParams['ytick.direction'] = 'in'
u1 = np.linspace(0, np.pi*(2/3), 1000)
u2 = np.linspace(np.pi*(1/3), np.pi, 1000)
v = np.linspace(-np.pi, np.pi, 1000)
u1, V = np.meshgrid(u1, v)
u2, V = np.meshgrid(u2, v)
x1 = 2*np.sin(u1)*np.cos(V)
y1 = 2*np.sin(u1)*np.sin(V)
x2 = 2*np.sin(u2)*np.cos(V)
y2 = 2*np.sin(u2)*np.sin(V)
z1 = 2 + 2*np.cos(u1)
z2 = 2*np.cos(u2)
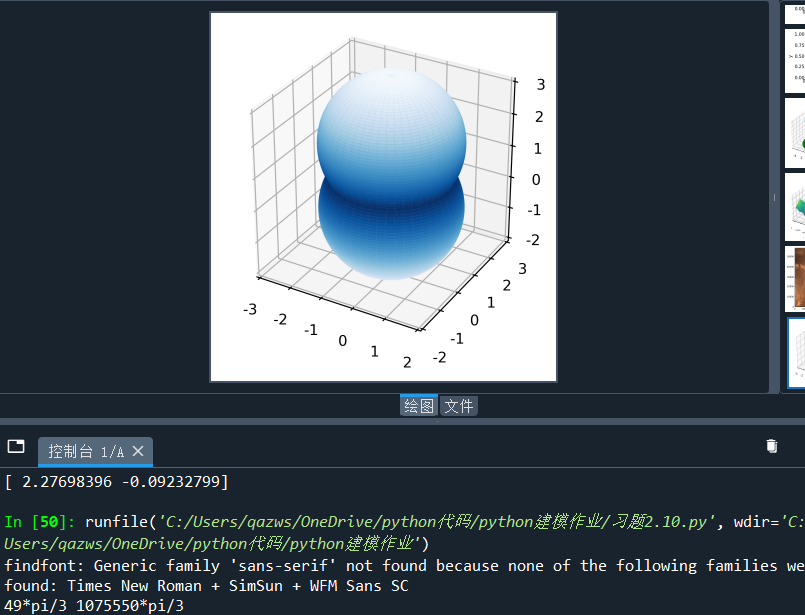
fig = plt.figure(dpi=500)
ax = fig.add_subplot(111, projection='3d')
ax.plot_surface(x1, y1, z1, cmap='Blues_r')
ax.plot_surface(x2, y2, z2, cmap='Blues')
ax.set_box_aspect((1, 1, 1))
ax.set_xlim(-3, 2)
ax.set_ylim(-2, 3)
ax.set_zlim(-2, 3)
y = sp.var('y')
f1 = sp.pi*(4*y - y**2)
f2 = sp.pi*(4 - y**2)
V = sp.integrate(f1, (y, 1, 3)) + sp.integrate(f2, (y, -2, 1))
W = 1000*sp.Rational(98, 10)*\
    (sp.integrate(f1*(3-y), (y, 1, 3)) + sp.integrate(f2*(3-y), (y, -2, 1)))
print(V, W)
习题2.11
import pandas as pd
import sympy as sp
sp.init_printing(use_unicode=True)
import matplotlib.pyplot as plt
plt.rcParams['font.sans-serif']=['Times New Roman + SimSun + WFM Sans SC']
plt.rcParams['mathtext.fontset']='cm'

plt.rcParams['axes.unicode_minus']=False
plt.rcParams['figure.dpi'] = 200

plt.rcParams['xtick.direction'] = 'in'
plt.rcParams['ytick.direction'] = 'in'
f = lambda x: (np.abs(x+1) - np.abs(x-1))/2 + np.sin(x)
g = lambda x: (np.abs(x+3) - np.abs(x-3))/2 + np.cos(x)
eqs = lambda x: [
    2*x[0] - 3*f(x[2]) - 4*g(x[3]) + 1,
    3*x[1] - 2*f(x[2]) - 6*g(x[3]) + 2,
    x[2] - f(x[0]) - 3*g(x[1]) + 3,
    5*x[3] - 4*f(x[0]) - 6*g(x[1]) + 1
]
from scipy.optimize import least_squares
least_squares(eqs, np.random.randn(4))
习题2.12
import sympy as sp
import matplotlib.pyplot as plt
sp.init_printing(use_unicode=True)
plt.rcParams['font.sans-serif'] = ['Times New Roman + SimSun + WFM Sans SC']
plt.rcParams['mathtext.fontset'] = 'cm'
plt.rcParams['axes.unicode_minus'] = False
plt.rcParams['figure.dpi'] = 200
plt.rcParams['xtick.direction'] = 'in'
plt.rcParams['ytick.direction'] = 'in'
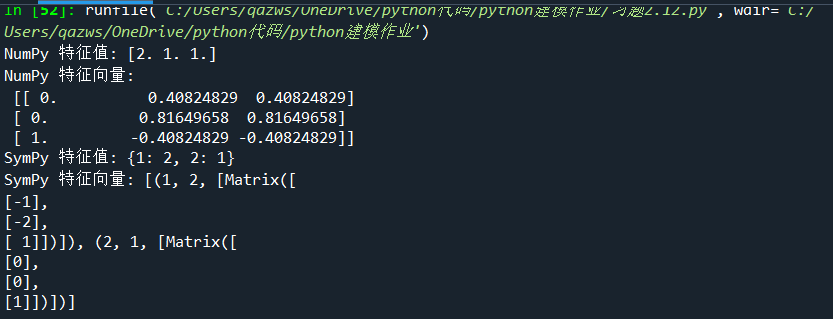
A = np.array([[-1, 1, 0], [-4, 3, 0], [1, 0, 2]])
va1, ve1 = np.linalg.eig(A)
print("NumPy 特征值:", va1)
print("NumPy 特征向量:\n", ve1)
A_sympy = sp.Matrix([[-1, 1, 0], [-4, 3, 0], [1, 0, 2]])
va2 = A_sympy.eigenvals()
ve2 = A_sympy.eigenvects()
print("SymPy 特征值:", va2)
print("SymPy 特征向量:", ve2)
习题2.13
import pandas as pd
import sympy as sp
import matplotlib.pyplot as plt
from scipy.optimize import least_squares
sp.init_printing(use_unicode=True)
plt.rcParams['font.sans-serif'] = ['Times New Roman + SimSun + WFM Sans SC']
plt.rcParams['mathtext.fontset'] = 'cm'
plt.rcParams['axes.unicode_minus'] = False
plt.rcParams['figure.dpi'] = 200
plt.rcParams['xtick.direction'] = 'in'
plt.rcParams['ytick.direction'] = 'in'
f = lambda x: (np.abs(x + 1) - np.abs(x - 1)) / 2 + np.sin(x)
g = lambda x: (np.abs(x + 3) - np.abs(x - 3)) / 2 + np.cos(x)
eqs = lambda z: [
    3 * f(z[2]) + 4 * g(z[3]) - 1 - 2 * z[0],
    2 * f(z[2]) + 6 * g(z[3]) - 2 - 3 * z[1],
    f(z[0]) + 3 * g(z[1]) - 3 - z[2],
    4 * f(z[0]) + 6 * g(z[1]) - 1 - 5 * z[3],
    f(z[3]) + g(z[1]) - 2 - z[0] - z[2],
    2 * f(z[0]) - 10 * g(z[2]) - 5 - z[1] - 3 * z[3]
]
initial_guess = np.random.randn(4)
result = least_squares(eqs, initial_guess)
print("解:", result.x)
print("成本函数值:", result.cost)
print("优化器状态:", result.message)


 浙公网安备 33010602011771号