AI 监控平台产品分析--Evidentlyai产品实践指南
大数据,人工智能浪潮席卷IT行业,最近数月Gen AI新产品频频亮相。让人不得不感叹,AI时代已经到来。对企业来说一般会构建AI平台,包括AI开发,训练平台,发布平台等。
但是,一般来说AI模型是面向特定的业务主题,而且对业务影响较大,从开发到上线周期较长,而且,对于AI模型的性能监控也是非常重要的一环,如果没有相应的监控平台,我想大多数AI模型是不敢上线使用的。这也是AI 监控平台的主要作用:
监控模型质量,以便及时对模型进行重新训练和调整。
本文从AI平台整体架构,AI平台能力链条,evidentlyai产品实践等方面展开。
ai平台架构:
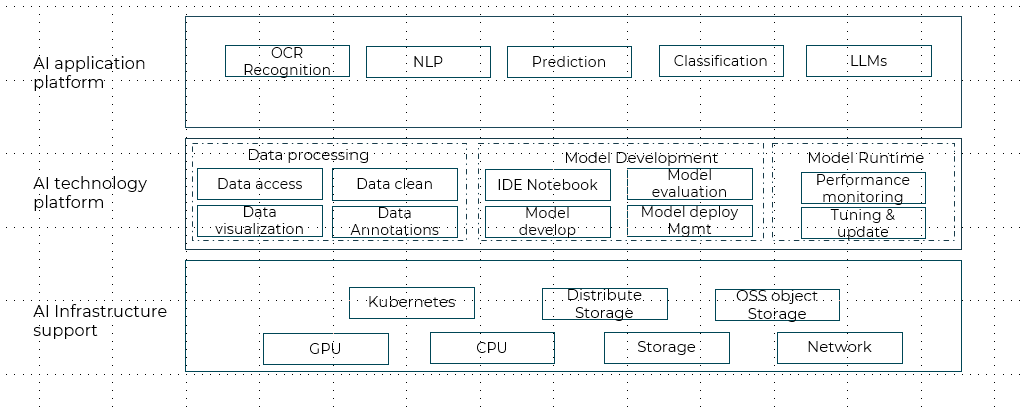
整体上分为三层:
1.基础能力层,包括CPU,GPU,存储等基础设施能力
2.技术平台层,包括数据处理,模型开发,模型运行,管理,监控等模块
3.AI应用层,包括各种类型的AI模型
AI平台能力链条:
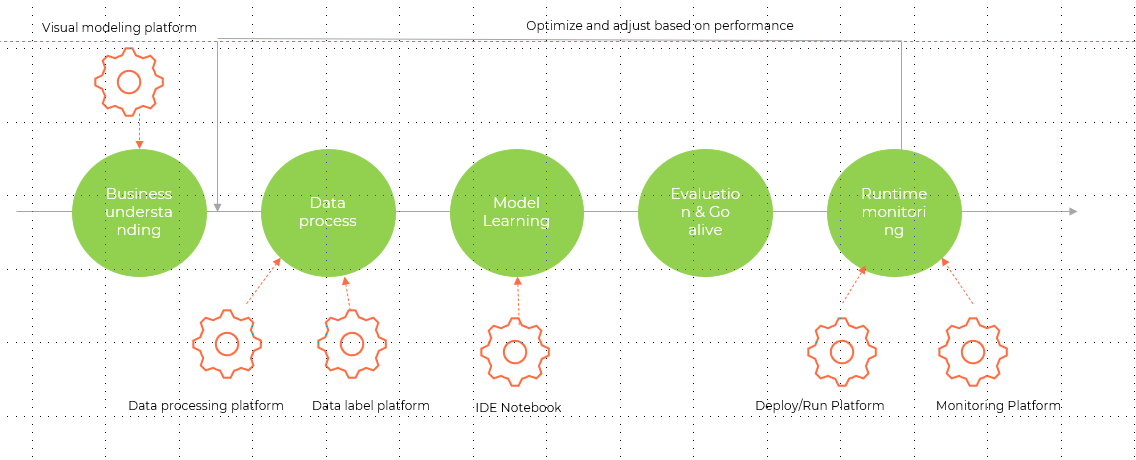
从AI平台的能力上来看,主要分为:
1.业务理解,对应可视化建模平台
2.数据处理,对应为数据处理平台,数据标签平台
3.模型开发平台,对应为model开发IDE notebook
4.模型评估和上线
5.模型运行平台,对应模型运行平台和监控平台
通过模型的监控,发现模型质量的偏差和问题,进而及时对模型进行调整,这样形成模型开发的闭环,确保模型能够持续改进,适应业务的需求。
模型监控及模型监控工具--evidentlyai
关于模型监控,一般从三个层面来进行考虑:
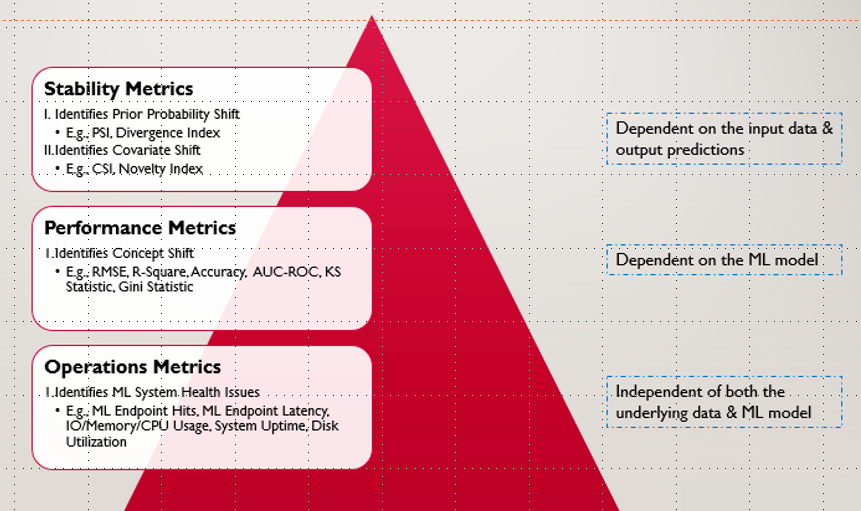
1.运维层面:包括模型的访问次数,访问延迟时间,CPU/MEM/IO等系统状况
2.模型性能层面:包括用来识别concept drift的RMSE,AUC-ROC,KS统计等指标
3.模型稳定性矩阵:包括PSI指数和CSI指数
我们可以从下面这些方面来进行考虑:
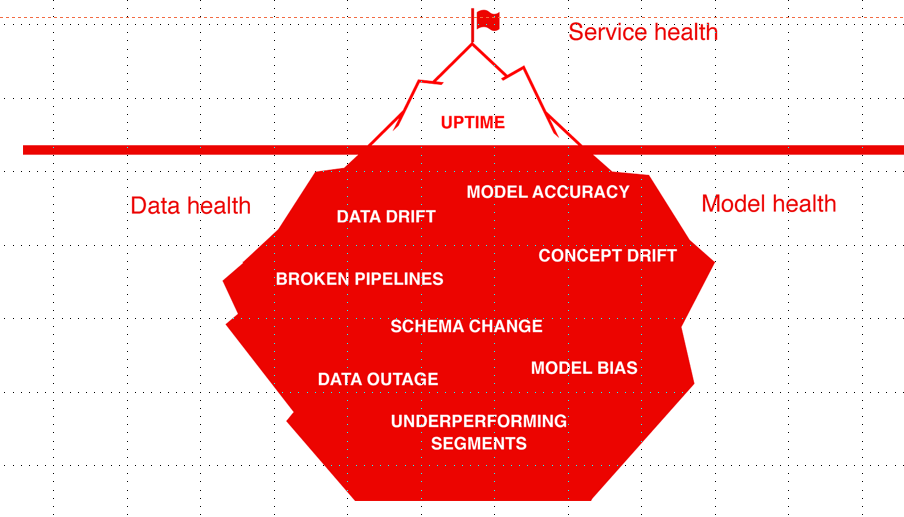
1. 数据质量和完整性
--验证输入数据是否符合我们的期望至关重要。检查可能包括范围合规性、数据分布、特征统计、 相关性或我们认为数据集“正常”的任何行为。
--确认我们正在提供模型可以处理的数据
2. 数据和目标漂移
--当模型接收到它在训练中没有看到的数据时,我们可能会遇到数据漂移。
--当现实世界的模式发生变化,我们可能会遇到概念漂移。(模型不再适用,如: 影响所有客户行为的全球流行病,出现新的影响因素 )
-- 目标是获得概念或数据发生变化的早期信号,及时更新我们的模型了
3. 模型性能
-- 将模型的预测与实际值进行对比,对比KPI如:分类的Precision/Recall、回归的 RMSE
以上面的三条为评判依据,我们搜集了业界市面上的AI监控平台及解决方案,并进行了对比:
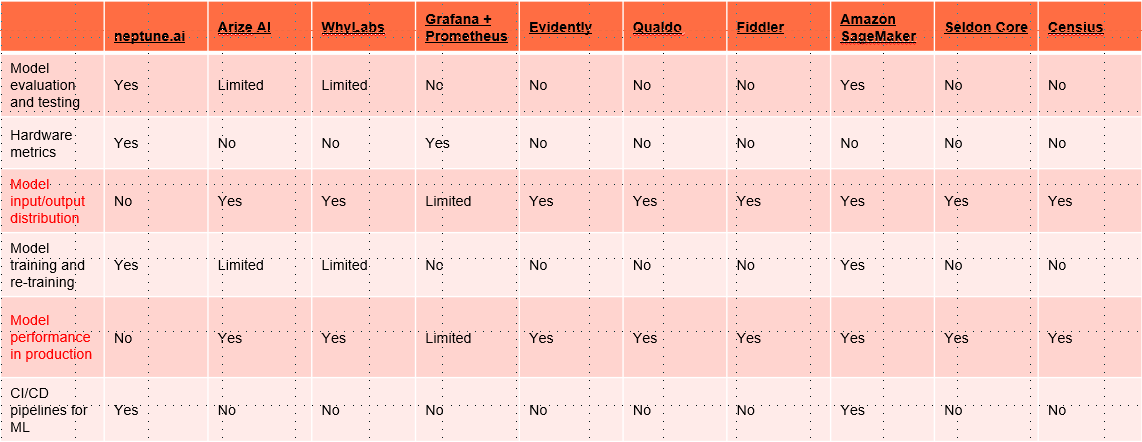
综合发现,Evidently是一款能够满足我们需求的开源产品,所以,先锁定Evidently进行研究。
---------------------------------------------------分割线---------------------------------------------------------------------------
进入官网,映入眼帘的是对产品的介绍:
The open-source ML observability platform
Evaluate, test, and monitor ML models from validation to production.
From tabular data to NLP and LLM. Built for data scientists and ML engineers.
研究过程我就不在此坠述了,直接上我们的解决方案吧,我们目前部署模型,暴露为api方式供调用,Evidently提供了多种接入和使用方式:
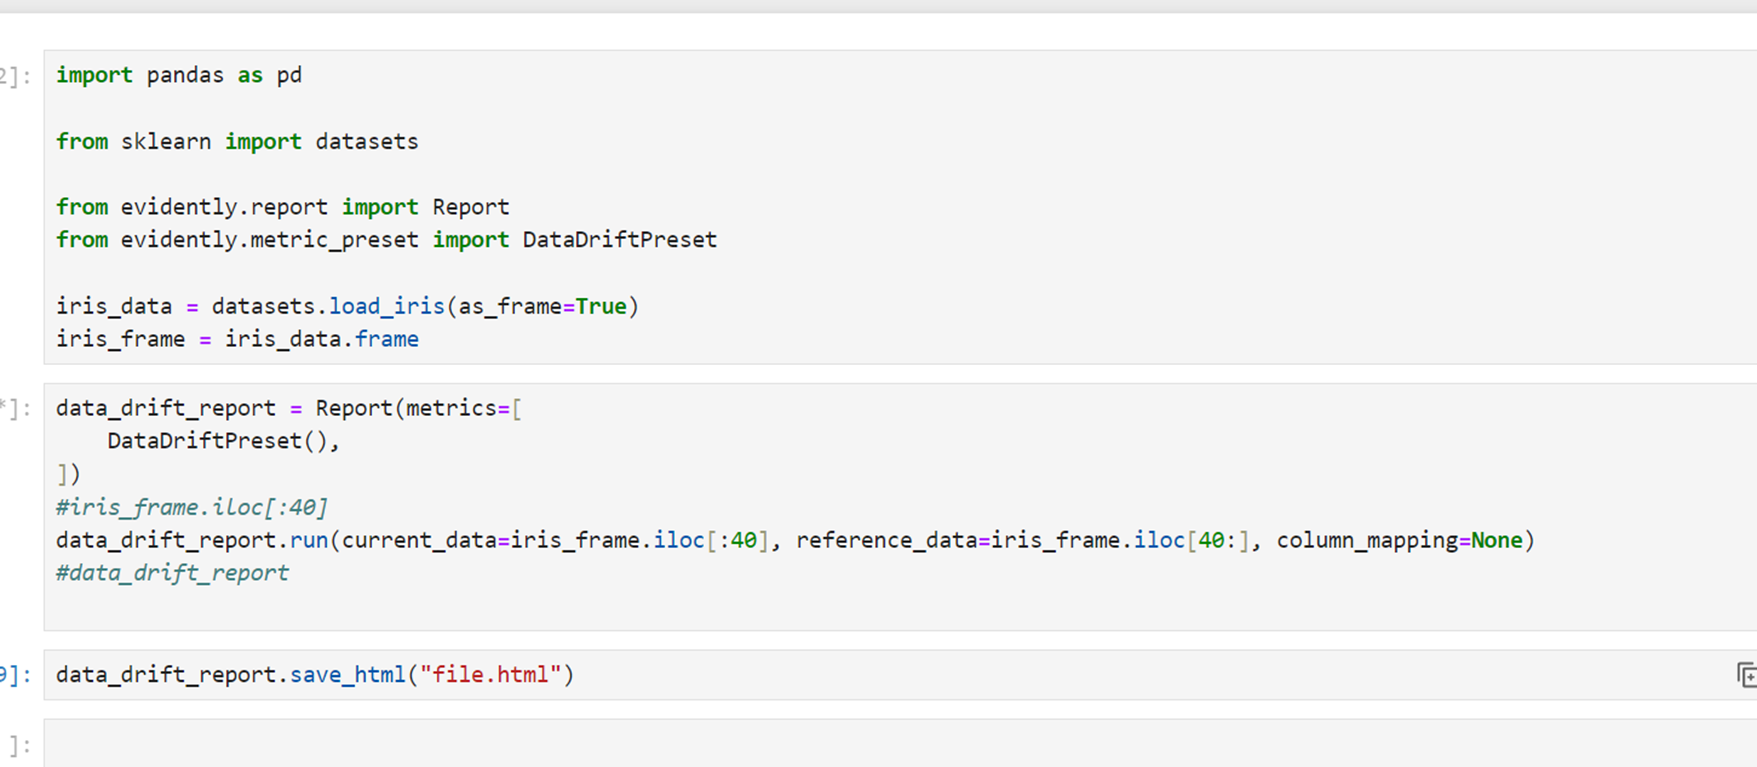
1.以python包的形式引入,可在开发过程中可视化模型性能指标,并生成html报告。
2.针对批量模型,可以结合调度工具airflow,定时批量生成报告,结合dashboard进行展示
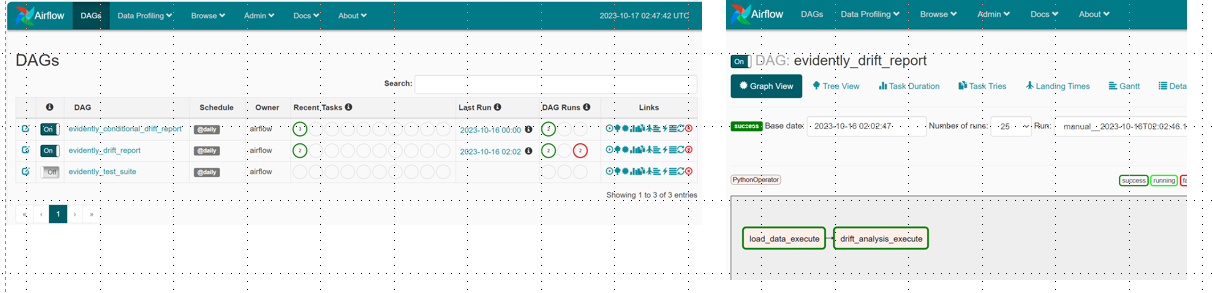
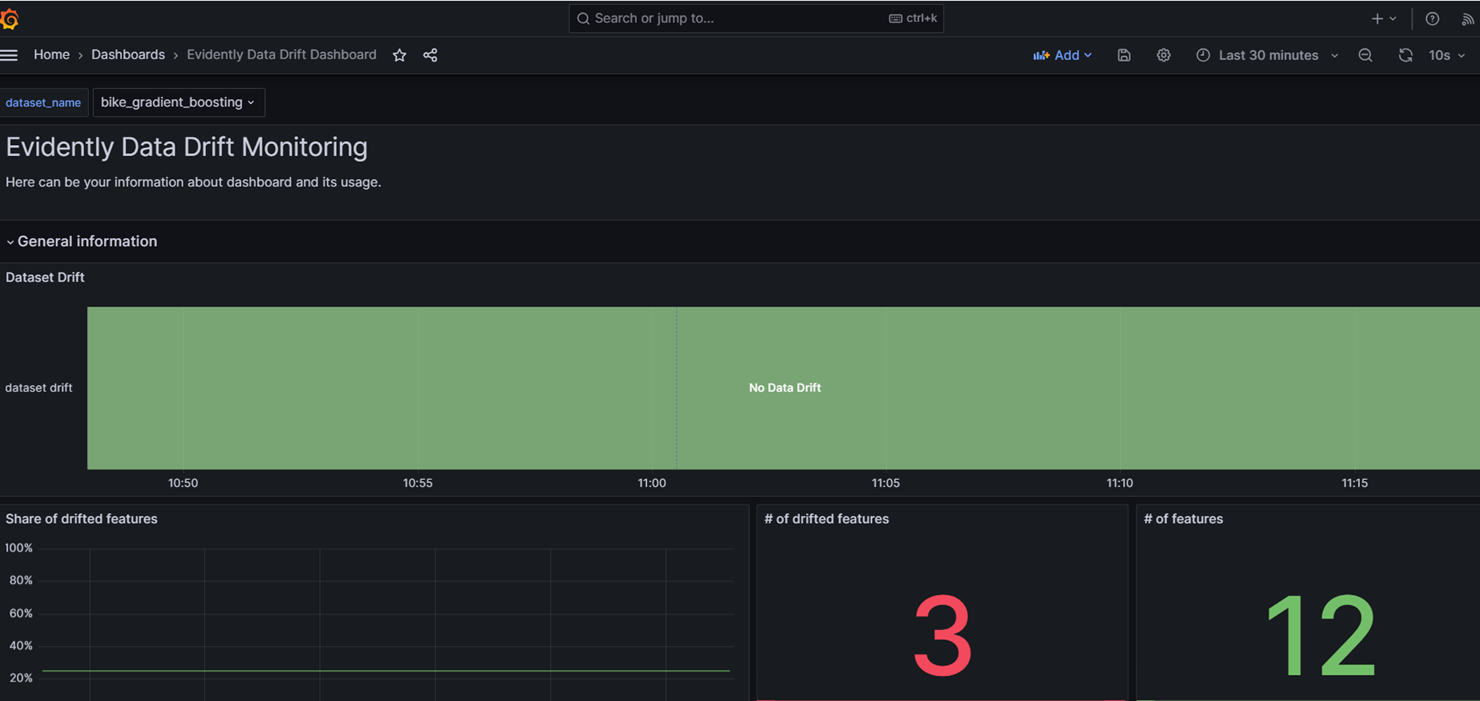
dashboard:
3.针对实时场景,可以使用Granfana + Prometheus + Evidently来实现实时监控
以上三种都是在官网提供的参考指南,可以在下面网址找到不同案例的实践指南:
https://docs.evidentlyai.com/integrations/evidently-integrations
https://github.com/evidentlyai/evidently/tree/main/examples/integrations
整体上来讲,第一种是基础,第二种具备可实施的条件,第三种dashboard还不够全面,实施难度较大。选择第二种方案来验证。
------------------------------------------分割线------------------------------------------------------------
我们本地开发了一个二手车估值的regression模型,用这个例子来做验证。
1.下载evidentlyai到机器
git clone git@github.com:evidentlyai/evidently.git
2.我们主要使用两个项目:
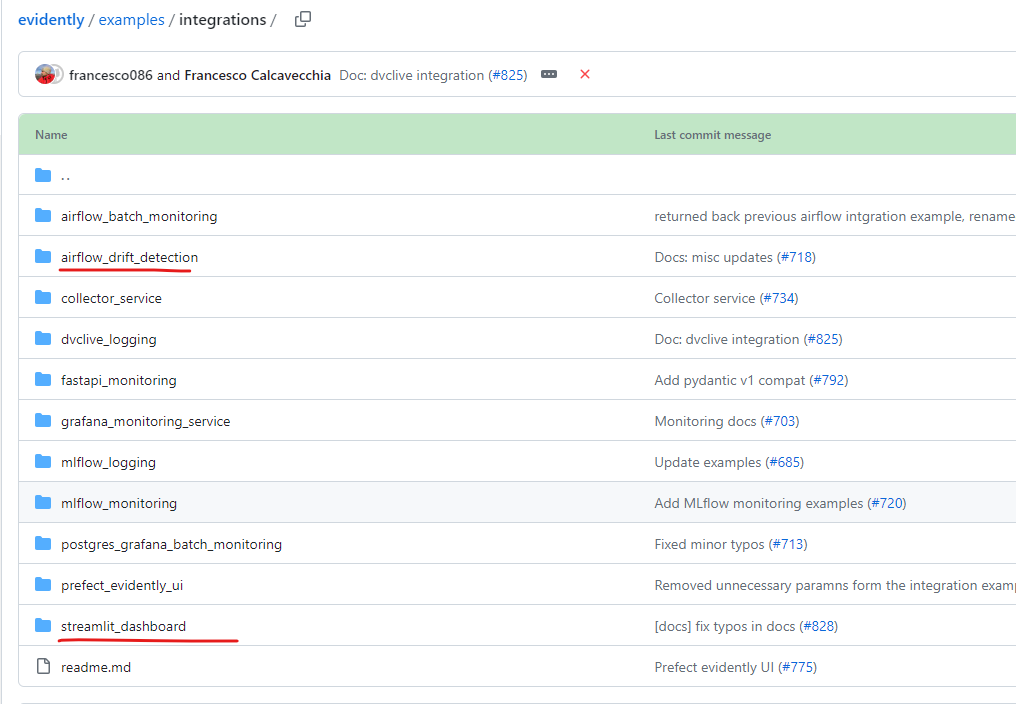
airflow_drift_detection使用airflow创建pipline触发生成模型性能质量报告,streamlit_dashboard用来进行报告展示。
3.airflow_drift_detection 安装
修改dckerfile/Dockerfile


FROM puckel/docker-airflow:1.10.9
RUN pip config set global.index-url https://pypi.tuna.tsinghua.edu.cn/simple
RUN pip install evidently==0.2.0

#RUN useradd -d /home/ubuntu -ms /bin/bash -g root -G sudo -p ubuntu ubuntu
#RUN mkdir /opt/myvolume  && chown ubuntu /opt/myvolume
#WORKDIR /home/ubuntu
#VOLUME /opt/myvolume
修改docker-compose.yml 主要修改目录映射关系,将报告直接生成到streamlit_dashboard中对应的目录
version: '3.7'

services:
  postgres:
    image: postgres:9.6
    environment:
      - POSTGRES_USER=airflow
      - POSTGRES_PASSWORD=airflow
      - POSTGRES_DB=airflow
    logging:
      options:
        max-size: 10m
        max-file: "3"

  webserver:
    build: ./dockerfiles
    user: "airflow:airflow"
    restart: always
    depends_on:
      - postgres
    environment:
      - LOAD_EX=n
      - EXECUTOR=Local
    logging:
      options:
        max-size: 10m
        max-file: "3"
    volumes:
      - ./dags:/usr/local/airflow/dags
      - ../streamlit_dashboard/projects:/usr/local/airflow/reports
        #- ./evidently_reports:/usr/local/airflow/reports
    ports:
      - "8080:8080"
    command: webserver
    healthcheck:
      test: ["CMD-SHELL", "[ -f /usr/local/airflow/airflow-webserver.pid ]"]
      interval: 30s
      timeout: 30s
      retries: 3
volumes:
  evidently_reports:
到airflow_drift_detection 根目录:docker compose up --build -d
可能遇到无法生成报告问题,江睦路权限修改为777即可:chmod 777 ../streamlit_dashboard/projects
访问地址:********:8080/admin/
4.streamlit_dashboard安装
sudo su
切换到root
创建虚拟环境:
cd /home/uradataplatform/
python3 -m venv .venv
source ./venv/bin/activate
进入虚拟环境
进入项目目录:
cd /home/uradataplatform/sc/streamlit_dashboard
执行命令:
pip install -r requirements.txt -i https://pypi.tuna.tsinghua.edu.cn/simple
启动程序:
cd /home/uradataplatform/sc/streamlit_dashboard/
cd streamlit-app
streamlit run app.py &
访问地址:********:8051
5.pipline开发:
目前evidentlyai预置了7种报告:Data Quality,Data Drift,Target Drift,Classification performance,Regression performance,Text Overview,NoTargetPerformance
这里选择Data Drift,Target Drift,Regression performance三种报告展示:
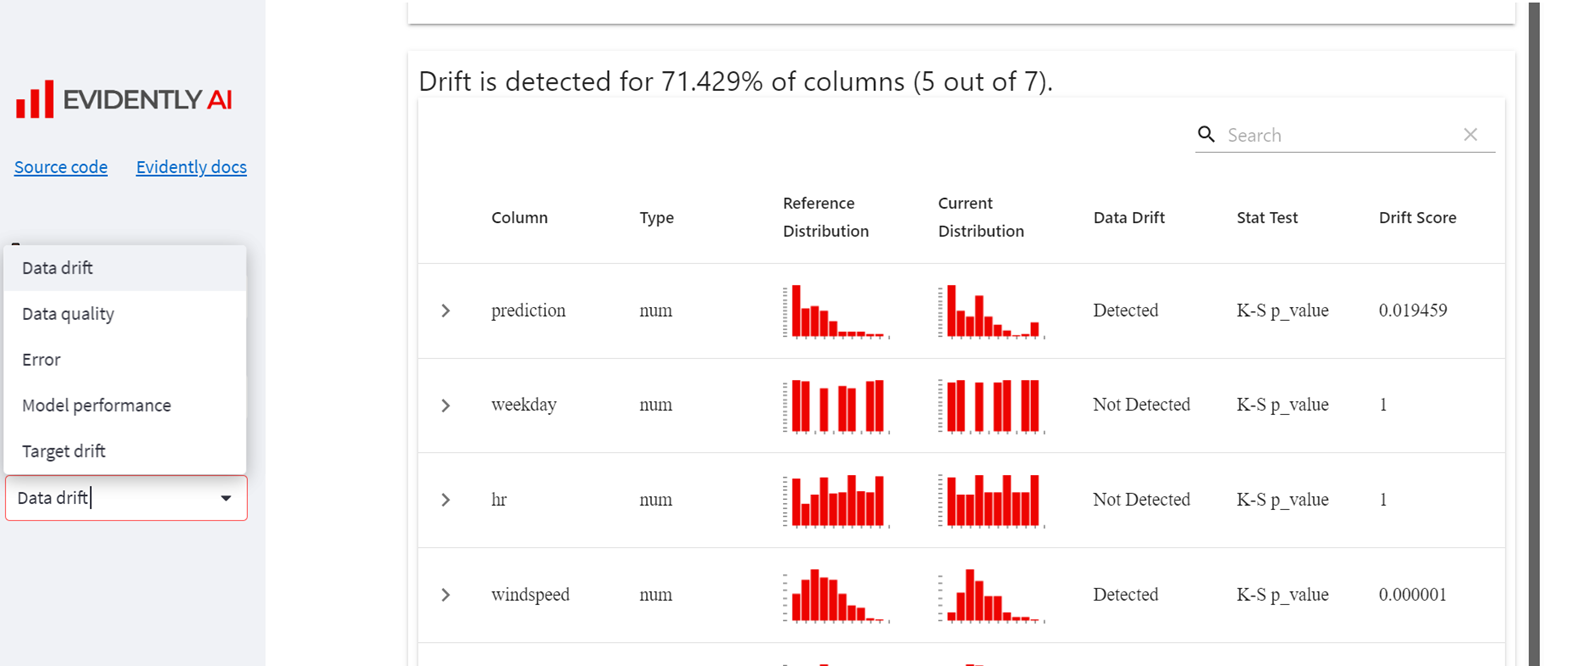
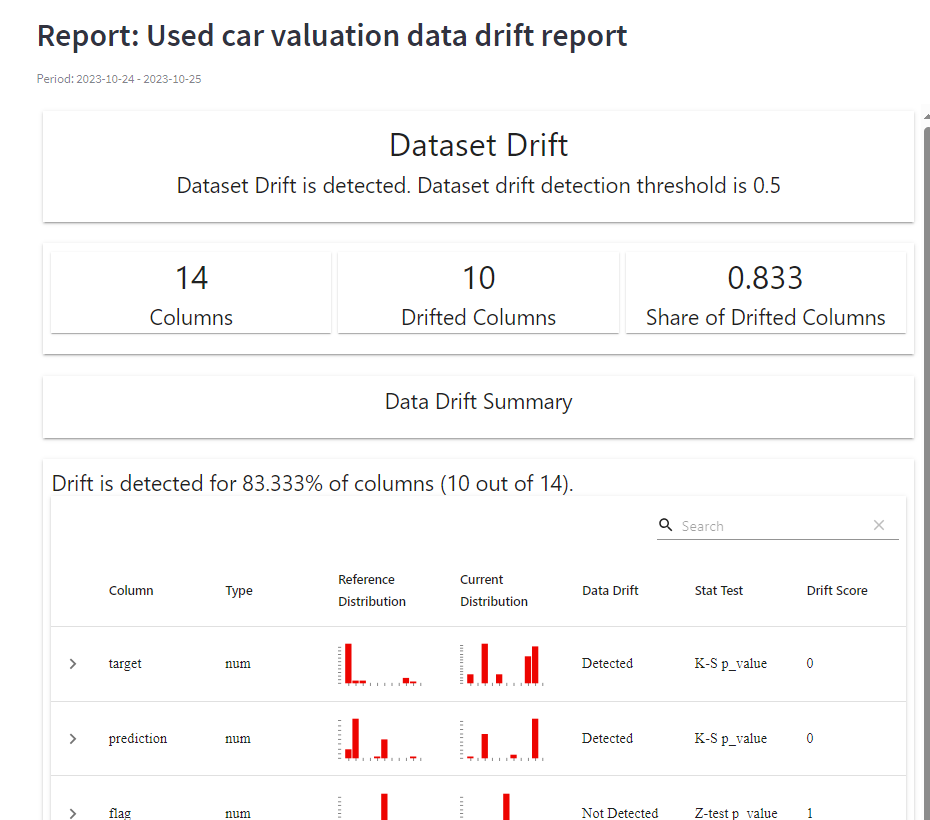
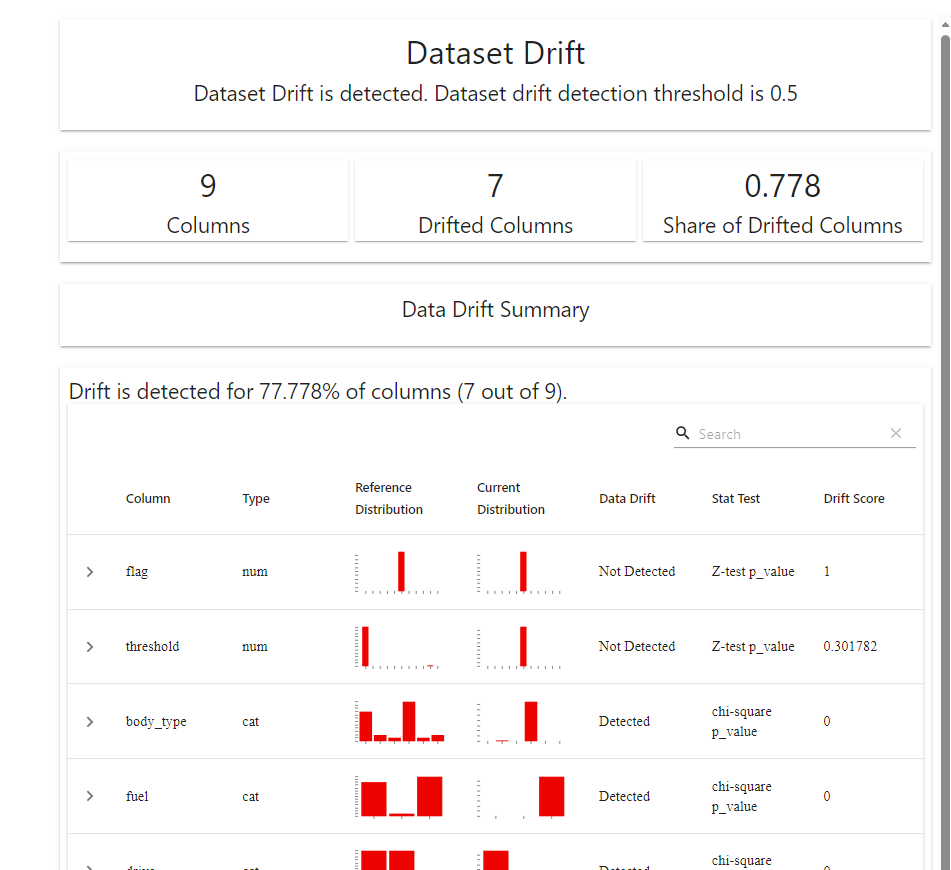
1>Data Drift report
try:
    import os

    from datetime import datetime
    from datetime import timedelta

    import psycopg2  #python用来操作postgreSQL数据库的第三方库
    import pandas as pd

    import pandas as pd
    from airflow import DAG
    from airflow.operators.python_operator import PythonOperator
    from sklearn import datasets

    from evidently.metric_preset import DataDriftPreset
    from evidently.pipeline.column_mapping import ColumnMapping
    from evidently.report import Report


except Exception as e:
    print("Error  {} ".format(e))

dir_path = "reports"
file_path = "used_car_valuation_data_drift_report.html"
project_name = "used_car_valuation"
#timstamp_area = "2023-10-10_2023-10-18"
# 获取当前日期和时间
now = datetime.now()
# 格式化日期和时间
format_today = now.strftime("%Y-%m-%d")
#yesterday
yesterday = now - timedelta(days=1)
format_yesterday =yesterday.strftime("%Y-%m-%d")
timstamp_area=format_yesterday+"_"+format_today
full_path = dir_path+'/'+project_name+'/reports/'+timstamp_area

def load_data_execute(**context):

    # 连接到一个给定的数据库
    conn = psycopg2.connect(database="radarSmartcustoms",user="radarSmartcustoms", password='', host="129.184.13.155", port='5433')
    cursor = conn.cursor() # 连接游标
    #获取数据表1中的列名
    sql1_text="""select string_agg(column_name,',') from information_schema.columns
            where table_schema='public' and table_name='valuation_model_res'
                    """
    cursor.execute(sql1_text)  #执行SQL语句
    # 获取SELECT返回的元组
    data1 = cursor.fetchall()  # 获取sql1_text中全部数据,此数据为嵌套元组数据(元组列表)
    #获取数据表1中的数据
    #sql2_text = "select * from valuation_model_res"
    now = datetime.now()
    # 格式化日期和时间
    format_today = now.strftime("%Y-%m-%d")
    sql2_text = "select * from public.valuation_model_res order by id desc limit 40"
    #sql2_text = "select vmr.* from public.valuation_model_res vmr,public.sad_item_basic_info sibi where vmr.uuid =sibi.uuid and sibi.inspect_date ='"+format_today+"'"
    cursor.execute(sql2_text) #执行SQL语句
    # 获取SELECT返回的元组
    data2 = cursor.fetchall()  # 获取sql2_text中全部数据
    #将获得的列名元组数据转换为列名列表数据
    columns_name = list(data1[0])[0].split(',')
    df1=pd.DataFrame(list(data2),columns=columns_name)
    columns_name
    del df1['id']
    del df1['uuid']
    del df1['item_no']
    del df1['cost_insurance_freight']
    del df1['free_on_board']
    #featrues data drift 不需要predict,target
    del df1['predict_price']
    del df1['declared_price']
    #df1.rename(columns={"predict_price": "prediction"}, inplace=True)
    #df1.rename(columns={"declared_price": "target"}, inplace=True)
    df1['threshold'] = df1['threshold'].astype(float)
    df1['ratio'] = df1['ratio'].astype(float)
    #df1['diffrence'] = df1['diffrence'].astype(float)
    #df1['prediction'] = df1['prediction'].astype(float)
    #df1['target'] = df1['target'].astype(float)
    #reference data
    sql3_text = "select * from public.valuation_model_reference"
    cursor.execute(sql3_text) #执行SQL语句
    data3 = cursor.fetchall()  # 获取sql3_text中全部数据
    #将获得的列名元组数据转换为列名列表数据
    columns_name = list(data1[0])[0].split(',')
    df2=pd.DataFrame(list(data3),columns=columns_name)
    columns_name
    del df2['id']
    del df2['uuid']
    del df2['item_no']
    del df2['cost_insurance_freight']
    del df2['free_on_board']
    #featrues data drift 不需要predict,target
    del df2['predict_price']
    del df2['declared_price']
    #df2.rename(columns={"predict_price": "prediction"}, inplace=True)
    #df2.rename(columns={"declared_price": "target"}, inplace=True)
    df2['threshold'] = df2['threshold'].astype(float)
    df2['ratio'] = df2['ratio'].astype(float)
    #df2['diffrence'] = df2['diffrence'].astype(float)
    #df2['prediction'] = df2['prediction'].astype(float)
    #df2['target'] = df2['target'].astype(float)

    cursor.close()  # 关闭游标
    conn.close()  # 关闭数据库连接--不需要使用数据库时,及时关闭数据库,可以减少所占内存
    data_columns = ColumnMapping()
    data_columns.numerical_features = [
        "mileage",
        #"target",
        #"prediction",
        "threshold",
        "ratio",
        #"diffrence",
        "flag"
    ]

    data_columns.categorical_features = ["maker", "country","drive","body_type","model","fuel"]

    context["ti"].xcom_push(key="data_frame", value=df1)
    context["ti"].xcom_push(key="data_frame_reference", value=df2)
    context["ti"].xcom_push(key="data_columns", value=data_columns)


def drift_analysis_execute(**context):
    data = context.get("ti").xcom_pull(key="data_frame")
    data_reference = context.get("ti").xcom_pull(key="data_frame_reference")
    data_columns = context.get("ti").xcom_pull(key="data_columns")

    data_drift_report = Report(metrics=[DataDriftPreset()])
    data_drift_report.run(reference_data=data_reference[:40], current_data=data[:40], column_mapping=data_columns)

    try:
        if os.path.exists(full_path):
            print('Current folder exists')
        else:
            print('Current folder not exists')
        #create file folder
        #os.mkdir(dir_path)
            os.makedirs(full_path)
            print("Creation of the directory {} succeed".format(full_path))
    except OSError:
        print("Creation of the directory {} failed".format(full_path))

    data_drift_report.save_html(os.path.join(full_path, file_path))


with DAG(
    dag_id="used_car_valuation_data_drift_report",
    schedule_interval="@daily",
    default_args={
        "owner": "airflow",
        "retries": 1,
        "retry_delay": timedelta(minutes=5),
        "start_date": datetime(2023, 10, 19),
    },
    catchup=False,
) as f:

    load_data_execute = PythonOperator(
        task_id="load_data_execute",
        python_callable=load_data_execute,
        provide_context=True,
        op_kwargs={"parameter_variable": "parameter_value"},  # not used now, may be used to specify data
    )

    drift_analysis_execute = PythonOperator(
        task_id="drift_analysis_execute",
        python_callable=drift_analysis_execute,
        provide_context=True,
    )

load_data_execute >> drift_analysis_execute
报告样例:
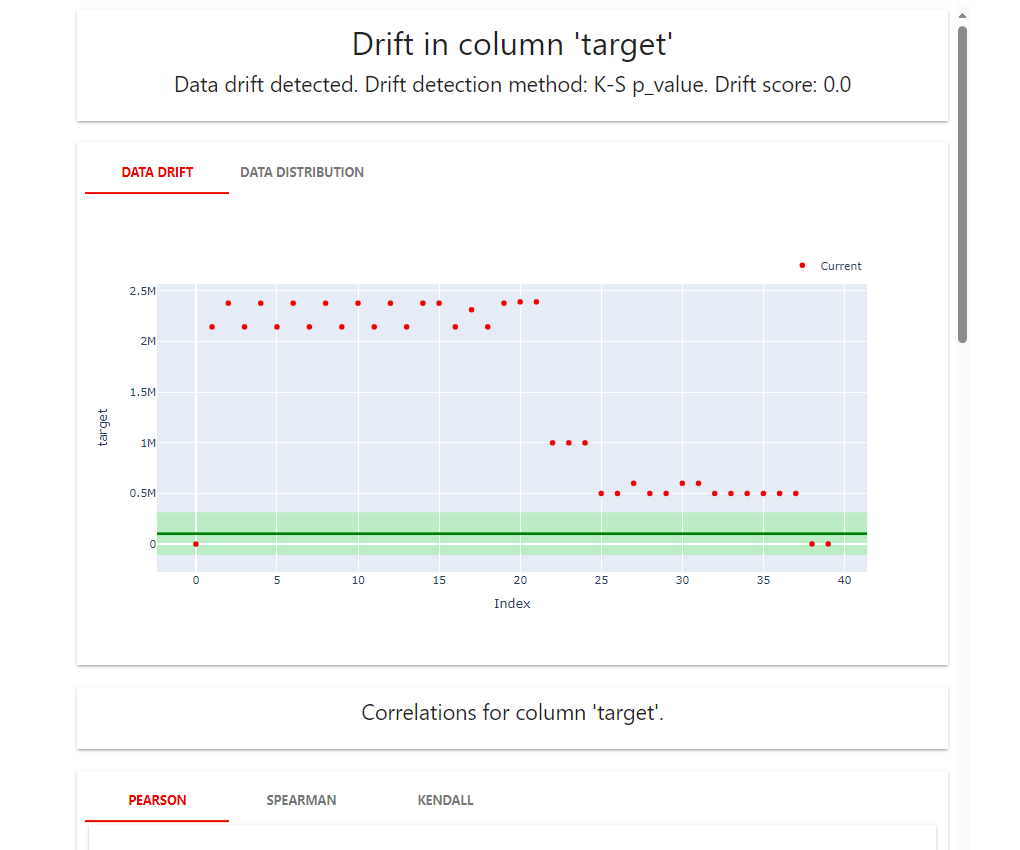
2>.Target Drift
try:
    import os

    from datetime import datetime
    from datetime import timedelta

    import psycopg2  #python用来操作postgreSQL数据库的第三方库
    import pandas as pd

    import pandas as pd
    from airflow import DAG
    from airflow.operators.python_operator import PythonOperator
    from sklearn import datasets

    from evidently.metric_preset import TargetDriftPreset
    from evidently.pipeline.column_mapping import ColumnMapping
    from evidently.report import Report


except Exception as e:
    print("Error  {} ".format(e))

dir_path = "reports"
file_path = "used_car_valuation_target_drift_report.html"
project_name = "used_car_valuation"
#timstamp_area = "2023-10-10_2023-10-18"
# 获取当前日期和时间
now = datetime.now()
# 格式化日期和时间
format_today = now.strftime("%Y-%m-%d")
#yesterday
yesterday = now - timedelta(days=1)
format_yesterday =yesterday.strftime("%Y-%m-%d")
timstamp_area=format_yesterday+"_"+format_today
full_path = dir_path+'/'+project_name+'/reports/'+timstamp_area

def load_data_execute(**context):

    # 连接到一个给定的数据库
    conn = psycopg2.connect(database="radarSmartcustoms",user="radarSmartcustoms", password='', host="129.184.13.155", port='5433')
    cursor = conn.cursor() # 连接游标
    #获取数据表1中的列名
    sql1_text="""select string_agg(column_name,',') from information_schema.columns
            where table_schema='public' and table_name='valuation_model_res'
                    """
    cursor.execute(sql1_text)  #执行SQL语句
    # 获取SELECT返回的元组
    data1 = cursor.fetchall()  # 获取sql1_text中全部数据,此数据为嵌套元组数据(元组列表)
    #获取数据表1中的数据
    #sql2_text = "select * from valuation_model_res"
    now = datetime.now()
    # 格式化日期和时间
    format_today = now.strftime("%Y-%m-%d")
    sql2_text = "select * from public.valuation_model_res order by id desc limit 40"
    #sql2_text = "select vmr.* from public.valuation_model_res vmr,public.sad_item_basic_info sibi where vmr.uuid =sibi.uuid and sibi.inspect_date ='"+format_today+"'"
    cursor.execute(sql2_text) #执行SQL语句
    # 获取SELECT返回的元组
    data2 = cursor.fetchall()  # 获取sql2_text中全部数据
    #将获得的列名元组数据转换为列名列表数据
    columns_name = list(data1[0])[0].split(',')
    df1=pd.DataFrame(list(data2),columns=columns_name)
    columns_name
    del df1['id']
    del df1['uuid']
    del df1['item_no']
    del df1['cost_insurance_freight']
    del df1['free_on_board']
    df1.rename(columns={"predict_price": "prediction"}, inplace=True)
    df1.rename(columns={"declared_price": "target"}, inplace=True)
    df1['threshold'] = df1['threshold'].astype(float)
    df1['ratio'] = df1['ratio'].astype(float)
    df1['diffrence'] = df1['diffrence'].astype(float)
    df1['prediction'] = df1['prediction'].astype(float)
    df1['target'] = df1['target'].astype(float)
    #reference data
    sql3_text = "select * from public.valuation_model_reference"
    cursor.execute(sql3_text) #执行SQL语句
    data3 = cursor.fetchall()  # 获取sql3_text中全部数据
    #将获得的列名元组数据转换为列名列表数据
    columns_name = list(data1[0])[0].split(',')
    df2=pd.DataFrame(list(data3),columns=columns_name)
    columns_name
    del df2['id']
    del df2['uuid']
    del df2['item_no']
    del df2['cost_insurance_freight']
    del df2['free_on_board']
    df2.rename(columns={"predict_price": "prediction"}, inplace=True)
    df2.rename(columns={"declared_price": "target"}, inplace=True)
    df2['threshold'] = df2['threshold'].astype(float)
    df2['ratio'] = df2['ratio'].astype(float)
    df2['diffrence'] = df2['diffrence'].astype(float)
    df2['prediction'] = df2['prediction'].astype(float)
    df2['target'] = df2['target'].astype(float)
    cursor.close()  # 关闭游标
    conn.close()  # 关闭数据库连接--不需要使用数据库时,及时关闭数据库,可以减少所占内存
    data_columns = ColumnMapping()
    data_columns.numerical_features = [
        "mileage",
        "target",
        "prediction",
        "threshold",
        "ratio",
        "diffrence",
        "flag"
    ]

    data_columns.categorical_features = ["maker", "country","drive","body_type","model","fuel"]

    context["ti"].xcom_push(key="data_frame", value=df1)
    context["ti"].xcom_push(key="data_frame_reference", value=df2)
    context["ti"].xcom_push(key="data_columns", value=data_columns)


def drift_analysis_execute(**context):
    data = context.get("ti").xcom_pull(key="data_frame")
    data_reference = context.get("ti").xcom_pull(key="data_frame_reference")
    data_columns = context.get("ti").xcom_pull(key="data_columns")

    targer_drift_report = Report(metrics=[TargetDriftPreset()])
    targer_drift_report.run(reference_data=data_reference[:40], current_data=data[:40], column_mapping=data_columns)

    try:
        if os.path.exists(full_path):
            print('Current folder exists')
        else:
            print('Current folder not exists')
        #create file folder
        #os.mkdir(dir_path)
            os.makedirs(full_path)
            print("Creation of the directory {} succeed".format(full_path))
    except OSError:
        print("Creation of the directory {} failed".format(full_path))

    targer_drift_report.save_html(os.path.join(full_path, file_path))


with DAG(
    dag_id="used_car_valuation_target_drift_report",
    schedule_interval="@daily",
    default_args={
        "owner": "airflow",
        "retries": 1,
        "retry_delay": timedelta(minutes=5),
        "start_date": datetime(2023, 10, 19),
    },
    catchup=False,
) as f:

    load_data_execute = PythonOperator(
        task_id="load_data_execute",
        python_callable=load_data_execute,
        provide_context=True,
        op_kwargs={"parameter_variable": "parameter_value"},  # not used now, may be used to specify data
    )

    drift_analysis_execute = PythonOperator(
        task_id="drift_analysis_execute",
        python_callable=drift_analysis_execute,
        provide_context=True,
    )

load_data_execute >> drift_analysis_execute
报告样例:
3>.Regression performance
try:
    import os

    from datetime import datetime
    from datetime import timedelta

    import psycopg2  #python用来操作postgreSQL数据库的第三方库
    import pandas as pd

    import pandas as pd
    from airflow import DAG
    from airflow.operators.python_operator import PythonOperator
    from sklearn import datasets

    from evidently.metric_preset import RegressionPreset
    from evidently.pipeline.column_mapping import ColumnMapping
    from evidently.report import Report


except Exception as e:
    print("Error  {} ".format(e))

dir_path = "reports"
file_path = "used_car_valuation_performance_report.html"
project_name = "used_car_valuation"
#timstamp_area = "2023-10-10_2023-10-18"
# 获取当前日期和时间
now = datetime.now()
# 格式化日期和时间
format_today = now.strftime("%Y-%m-%d")
#yesterday
yesterday = now - timedelta(days=1)
format_yesterday =yesterday.strftime("%Y-%m-%d")
timstamp_area=format_yesterday+"_"+format_today
full_path = dir_path+'/'+project_name+'/reports/'+timstamp_area

def load_data_execute(**context):

    # 连接到一个给定的数据库
    conn = psycopg2.connect(database="radarSmartcustoms",user="radarSmartcustoms", password='', host="129.184.13.155", port='5433')
    cursor = conn.cursor() # 连接游标
    #获取数据表1中的列名
    sql1_text="""select string_agg(column_name,',') from information_schema.columns
            where table_schema='public' and table_name='valuation_model_res'
                    """
    cursor.execute(sql1_text)  #执行SQL语句
    # 获取SELECT返回的元组
    data1 = cursor.fetchall()  # 获取sql1_text中全部数据,此数据为嵌套元组数据(元组列表)
    #获取数据表1中的数据
    #sql2_text = "select * from valuation_model_res"
    now = datetime.now()
    # 格式化日期和时间
    format_today = now.strftime("%Y-%m-%d")
    sql2_text = "select * from public.valuation_model_res order by id desc limit 40"
    #sql2_text = "select vmr.* from public.valuation_model_res vmr,public.sad_item_basic_info sibi where vmr.uuid =sibi.uuid and sibi.inspect_date ='"+format_today+"'"
    cursor.execute(sql2_text) #执行SQL语句
    # 获取SELECT返回的元组
    data2 = cursor.fetchall()  # 获取sql2_text中全部数据
    #将获得的列名元组数据转换为列名列表数据
    columns_name = list(data1[0])[0].split(',')
    df1=pd.DataFrame(list(data2),columns=columns_name)
    columns_name
    del df1['id']
    del df1['uuid']
    del df1['item_no']
    del df1['cost_insurance_freight']
    del df1['free_on_board']
    df1.rename(columns={"predict_price": "prediction"}, inplace=True)
    df1.rename(columns={"declared_price": "target"}, inplace=True)
    df1['threshold'] = df1['threshold'].astype(float)
    df1['ratio'] = df1['ratio'].astype(float)
    df1['diffrence'] = df1['diffrence'].astype(float)
    df1['prediction'] = df1['prediction'].astype(float)
    df1['target'] = df1['target'].astype(float)
    #reference data
    sql3_text = "select * from public.valuation_model_reference"
    cursor.execute(sql3_text) #执行SQL语句
    data3 = cursor.fetchall()  # 获取sql3_text中全部数据
    #将获得的列名元组数据转换为列名列表数据
    columns_name = list(data1[0])[0].split(',')
    df2=pd.DataFrame(list(data3),columns=columns_name)
    columns_name
    del df2['id']
    del df2['uuid']
    del df2['item_no']
    del df2['cost_insurance_freight']
    del df2['free_on_board']
    df2.rename(columns={"predict_price": "prediction"}, inplace=True)
    df2.rename(columns={"declared_price": "target"}, inplace=True)
    df2['threshold'] = df2['threshold'].astype(float)
    df2['ratio'] = df2['ratio'].astype(float)
    df2['diffrence'] = df2['diffrence'].astype(float)
    df2['prediction'] = df2['prediction'].astype(float)
    df2['target'] = df2['target'].astype(float)
    cursor.close()  # 关闭游标
    conn.close()  # 关闭数据库连接--不需要使用数据库时,及时关闭数据库,可以减少所占内存
    data_columns = ColumnMapping()
    data_columns.numerical_features = [
        "mileage",
        "target",
        "prediction",
        "threshold",
        "ratio",
        "diffrence",
        "flag"
    ]

    data_columns.categorical_features = ["maker", "country","drive","body_type","model","fuel"]

    context["ti"].xcom_push(key="data_frame", value=df1)
    context["ti"].xcom_push(key="data_frame_reference", value=df2)
    context["ti"].xcom_push(key="data_columns", value=data_columns)


def drift_analysis_execute(**context):
    data = context.get("ti").xcom_pull(key="data_frame")
    data_reference = context.get("ti").xcom_pull(key="data_frame_reference")
    data_columns = context.get("ti").xcom_pull(key="data_columns")

    performance_report = Report(metrics=[RegressionPreset()])
    performance_report.run(reference_data=data_reference[:40], current_data=data[:40], column_mapping=data_columns)

    try:
        if os.path.exists(full_path):
            print('Current folder exists')
        else:
            print('Current folder not exists')
        #create file folder
        #os.mkdir(dir_path)
            os.makedirs(full_path)
            print("Creation of the directory {} succeed".format(full_path))
    except OSError:
        print("Creation of the directory {} failed".format(full_path))

    performance_report.save_html(os.path.join(full_path, file_path))


with DAG(
    dag_id="used_car_valuation_performance_report",
    schedule_interval="@daily",
    default_args={
        "owner": "airflow",
        "retries": 1,
        "retry_delay": timedelta(minutes=5),
        "start_date": datetime(2023, 10, 19),
    },
    catchup=False,
) as f:

    load_data_execute = PythonOperator(
        task_id="load_data_execute",
        python_callable=load_data_execute,
        provide_context=True,
        op_kwargs={"parameter_variable": "parameter_value"},  # not used now, may be used to specify data
    )

    drift_analysis_execute = PythonOperator(
        task_id="drift_analysis_execute",
        python_callable=drift_analysis_execute,
        provide_context=True,
    )

load_data_execute >> drift_analysis_execute
报告样例:
关于三个报告的指标的详细解读,请参见官方文档: https://docs.evidentlyai.com/presets/data-drift
写在最后,关于AI监控平台的研究,以及evidentyai的实践都是基于互联网资料的学习所得,分享给各位同学,供大家简单参考。

 浙公网安备 33010602011771号