
zabbix5.0
1:什么是监控?
监控: 生活中的监控, 事后追责
linux监控: 事后追责,实时监控,事前预警,性能分析
2:常见的linux监控命令
cpu: top uptime vmstat
mem free
disk df du
进程 ps pstree
网络 iftop nethogs
查看日志
3:使用shell脚本来监控服务器
#!/bin/bash
avai_mem=`free -m|awk '/Mem/{print $NF}'`
if [ $avai_mem -lt 1000 ];then
   #mail
fi
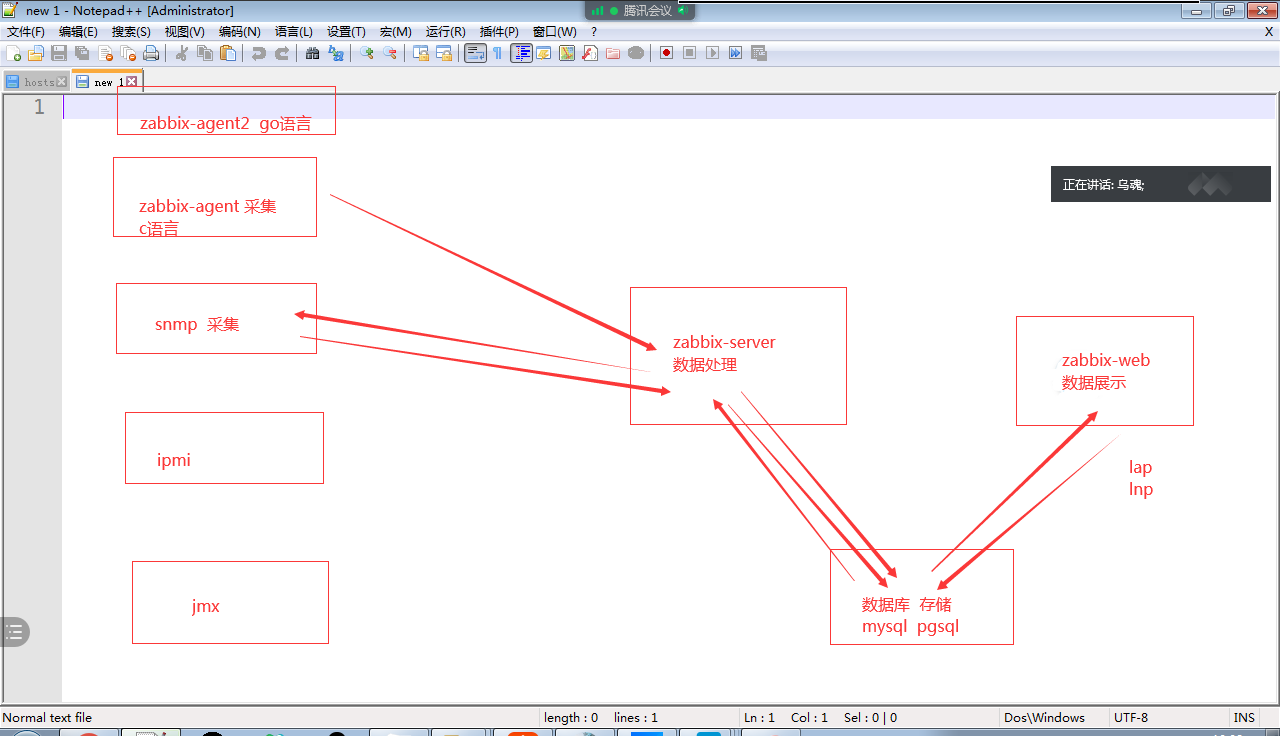
4: zabbix的基础服务架构
5: zabbix生产环境安装
选版本
安装依赖
#安装php72w和nginx
cd /etc/yum.repos.d/
rm -fr local.repo
curl -o /etc/yum.repos.d/CentOS-Base.repo http://mirrors.aliyun.com/repo/Centos-7.repo
curl -o /etc/yum.repos.d/epel.repo http://mirrors.aliyun.com/repo/epel-7.repo
wget http://mirror.webtatic.com/yum/el7/webtatic-release.rpm
yum localinstall webtatic-release.rpm -y
yum install php72w-fpm php72w-cli nginx -y
#安装php依赖
yum install php72w-mysqli php72w-bcmath php72w-gd php72w-mbstring  php72w-xml php72w-ldap -y
#配置nginx和php
vim  /etc/php-fpm.d/www.conf
[root@monitor ~]# grep -Ev "^$|;" /etc/php-fpm.d/www.conf
[www]
user = nginx
group = nginx
listen = 127.0.0.1:9000
[root@monitor ~]# grep -Ev "^$|;"  /etc/php.ini
[PHP]
max_execution_time = 300
max_input_time = 300
post_max_size = 16M
[Date]
date.timezone = Asia/Shanghai
#nginx配置文件
[root@monitor ~]# grep -Ev "^$|#"  /etc/nginx/nginx.conf
worker_processes  1;
events {
    worker_connections  1024;
}
http {
    include       mime.types;
    default_type  application/octet-stream;
    sendfile        on;
    keepalive_timeout  65;
    server {
        listen       80;
        server_name  localhost;
        location / {
            root   /data/zbx/html;
            index  index.php index.html index.htm;
        }
        error_page   500 502 503 504  /50x.html;
        location = /50x.html {
            root   html;
        }
	location ~ \.php$ {
            root           html;
            fastcgi_pass   127.0.0.1:9000;
            fastcgi_index  index.php;
            fastcgi_param  SCRIPT_FILENAME  /data/zbx/html$fastcgi_script_name;
            include        fastcgi_params;
        }
    }
}
#准备zabbix-web的源代码
wget  https://cdn.zabbix.com/zabbix/sources/stable/5.0/zabbix-5.0.5.tar.gz
tar xf zabbix-5.0.5.tar.gz
cd zabbix-5.0.5/
cp -a ui/* /html/
chown -R nginx:nginx /html/
mkdir /var/lib/php/session
chown -R nginx:nginx /var/lib/php/session
#安装数据库
yum install mariadb-server.x86_64 -y
systemctl start mariadb.service
systemctl enable mariadb.service
mysql_secure_installation
mysql
MariaDB [(none)]> create database zabbix character set utf8 collate utf8_bin;
Query OK, 1 row affected (0.00 sec)
MariaDB [(none)]> grant all privileges on zabbix.* to 'zabbix'@'localhost' identified by '123456';
Query OK, 0 rows affected (0.00 sec)
#安装zabbix-server
rpm -ivh  https://mirror.tuna.tsinghua.edu.cn/zabbix/zabbix/5.0/rhel/7/x86_64/zabbix-release-5.0-1.el7.noarch.rpm
yum install zabbix-server-mysql -y
zcat /usr/share/doc/zabbix-server-mysql-5.0.5/create.sql.gz|mysql -uzabbix -p123456  zabbix
#配置zabbix-server
[root@monitor zabbix]# grep -Ev "^$|#" zabbix_server.conf
LogFile=/var/log/zabbix/zabbix_server.log
LogFileSize=0
PidFile=/var/run/zabbix/zabbix_server.pid
SocketDir=/var/run/zabbix
DBName=zabbix
DBUser=zabbix
DBPassword=123456
SNMPTrapperFile=/var/log/snmptrap/snmptrap.log
Timeout=4
AlertScriptsPath=/usr/lib/zabbix/alertscripts
ExternalScripts=/usr/lib/zabbix/externalscripts
LogSlowQueries=3000
StatsAllowedIP=127.0.0.1
#启动zabbix-server
systemctl start zabbix-server.service
systemctl enable zabbix-server.service
#继续zabbix-web安装
6∶监控一台服务器主机
rpm -ivh https://mirror.tuna.tsinghua.edu.cn/zabbix/zabbix/5.0/rhel/7/x86_64/zabbix-agent2-5.0.5-1.el7.x86_64.rpm
vim /etc/zabbix/zabbix_agent2.conf
Server=10.0.0.71
systemctl start zabbix-agent2.service
systemctl enable zabbix-agent2.service
zabbix-web
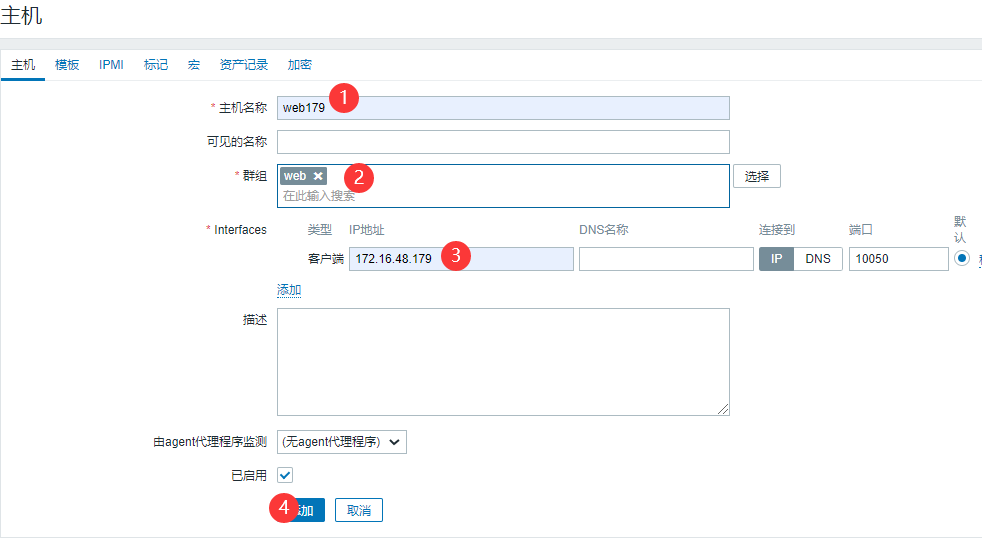
配置--主机--创建主机(右上角)
输入主机名称--群组--客户端ip地址--模板--关联Template OS Linux by Zabbix agent
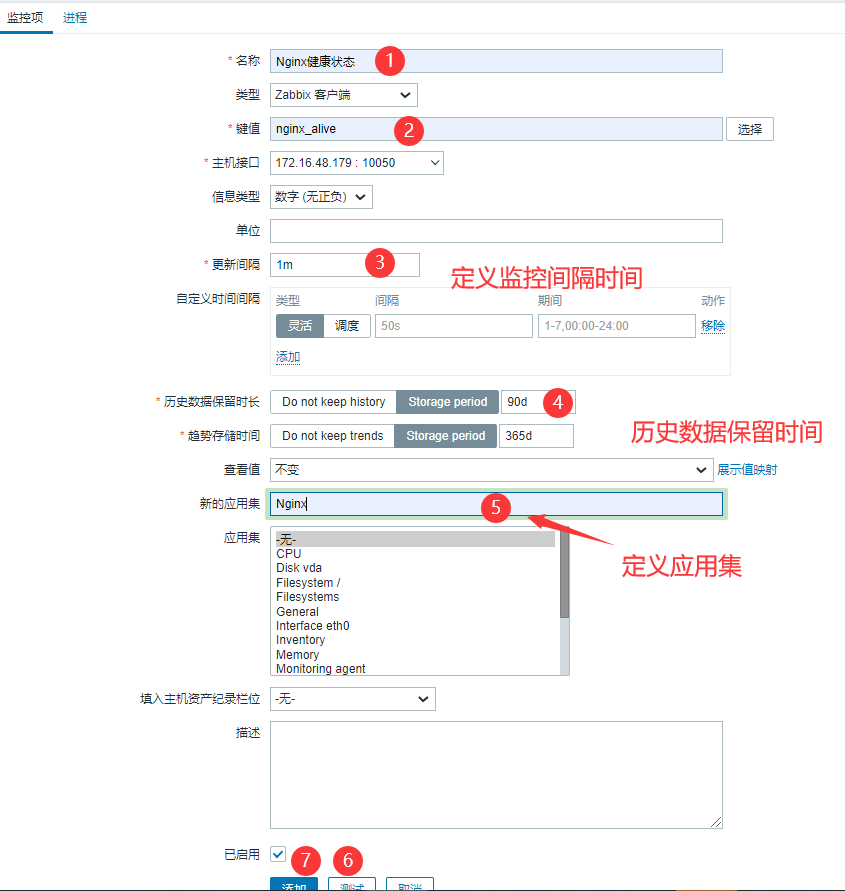
7∶自定义监控项
#agent端配置
vim /etc/zabbix/zabbix_agent2.d/zbx_nginx.conf
UserParameter=nginx_alive,ps -ef|grep -v grep|grep -c nginx
systemctl restart zabbix-agent2.service

#zabbix-server测试
zabbix_get -s 10.0.0.8 -k nginx_alive
zabbix-web
配置--主机--10.0.0.8--监控项--创建监控项
8∶自定义触发器
配置--主机--10.0.0.8--触发器--创建触发器
#触发器表达式
#最新值
{主机名称:key值.last()}=0
#平均值
{主机名称:key值.avg(5m)}=0
#count计数
{主机名称:key值.count(1m,10)}=0
#diff对比
{主机名称:key值.diff(1m,10)}=0

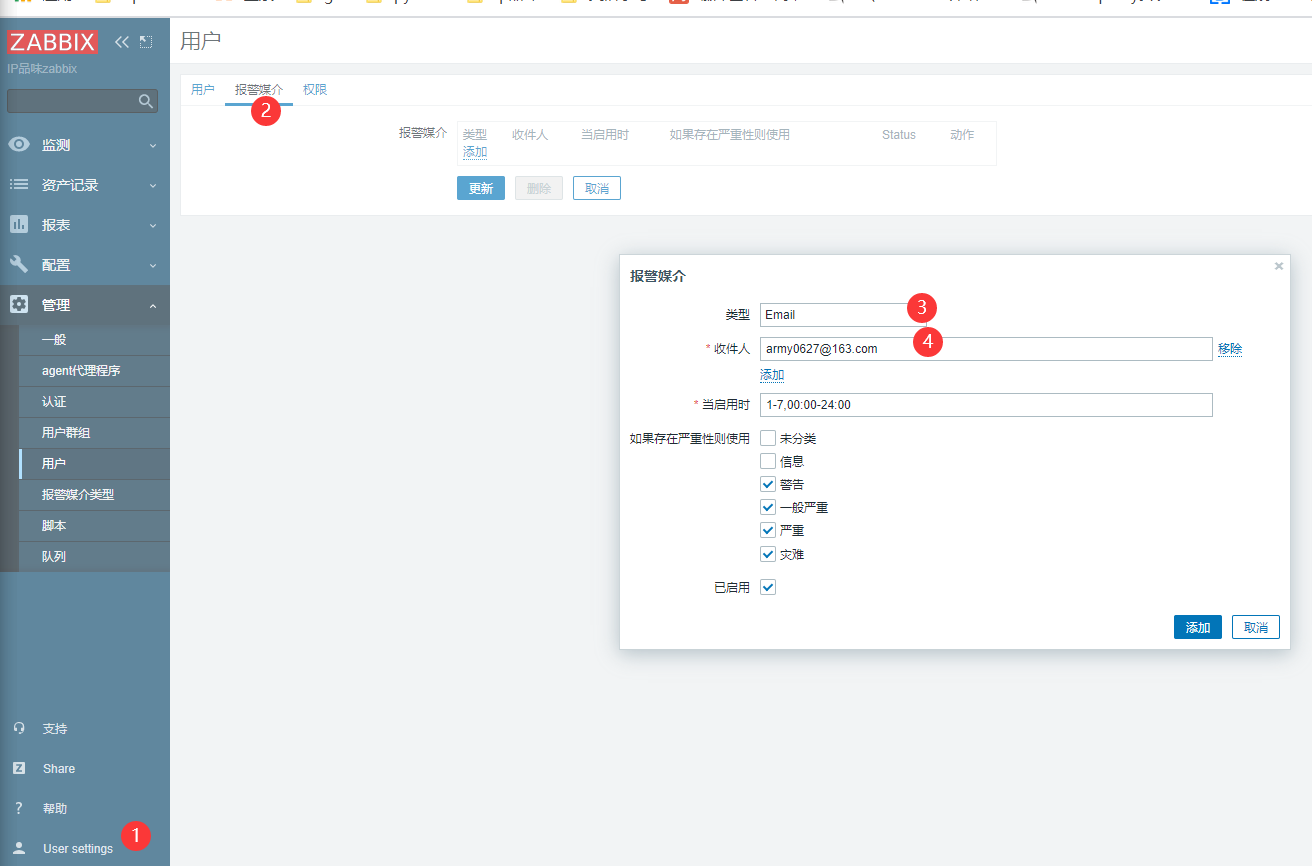
9:自定义报警
邮件报警
1:自定义发件人
管理--报警媒介类型--Email

收件人配置
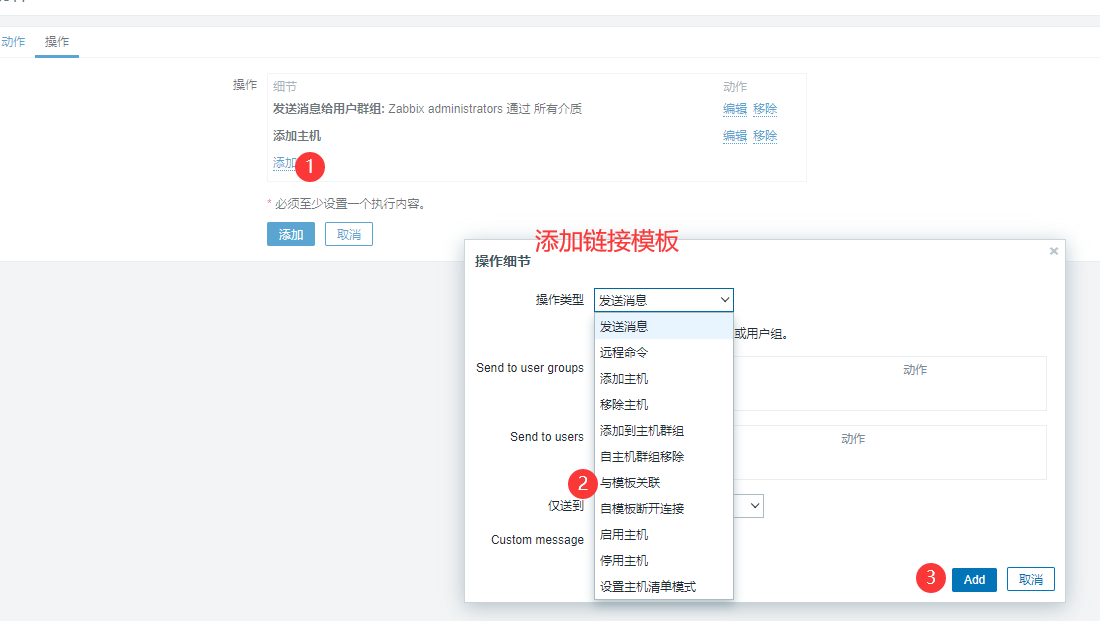
配置动作

3:启动发消息的动作
配置---动作--启动动作
微信报警
1:申请企业微信
2:准备微信报警脚本
vim  weixin.py
#企业id
corpid='wxd074861951c67ba6'
#应用的秘钥
appsecret='QtraZrI936DZ0jZ3aSWTZ2CsAePgZUn_5jZhgudChtI'
#应用的编号
agentid=1
yum install python2-pip -y
pip install requests
python weixin.py t296917342  '口令'  '今晚打老虎'
#!/usr/bin/env python
#-*- coding: utf-8 -*-
#author: bgx
#date: 2018
#comment: zabbix接入微信报警脚本

import requests
import sys
import os
import json
import logging

logging.basicConfig(level = logging.DEBUG, format = '%(asctime)s, %(filename)s, %(levelname)s, %(message)s',
                datefmt = '%a, %d %b %Y %H:%M:%S',
                filename = os.path.join('/tmp','weixin.log'),
                filemode = 'a')


corpid='**********'
appsecret='********************'
agentid=1
#获取accesstoken
token_url='https://qyapi.weixin.qq.com/cgi-bin/gettoken?corpid=' + corpid + '&corpsecret=' + appsecret
req=requests.get(token_url)
accesstoken=req.json()['access_token']

#发送消息
msgsend_url='https://qyapi.weixin.qq.com/cgi-bin/message/send?access_token=' + accesstoken

touser=sys.argv[1]
subject=sys.argv[2]
#toparty='3|4|5|6'
message=sys.argv[2] + "\n\n" +sys.argv[3]

params={
        "touser": touser,
#       "toparty": toparty,
        "msgtype": "text",
        "agentid": agentid,
        "text": {
                "content": message
        },
        "safe":0
}

req=requests.post(msgsend_url, data=json.dumps(params))

logging.info('sendto:' + touser + ';;subject:' + subject + ';;message:' + message)
3:新增报警媒介,添加发件人
mv weixin.py /usr/lib/zabbix/alertscripts/
#注意添加脚本参数
#{ALERT.SENDTO}, {ALERT.SUBJECT} and {ALERT.MESSAGE}
 、
、

4:添加收件人
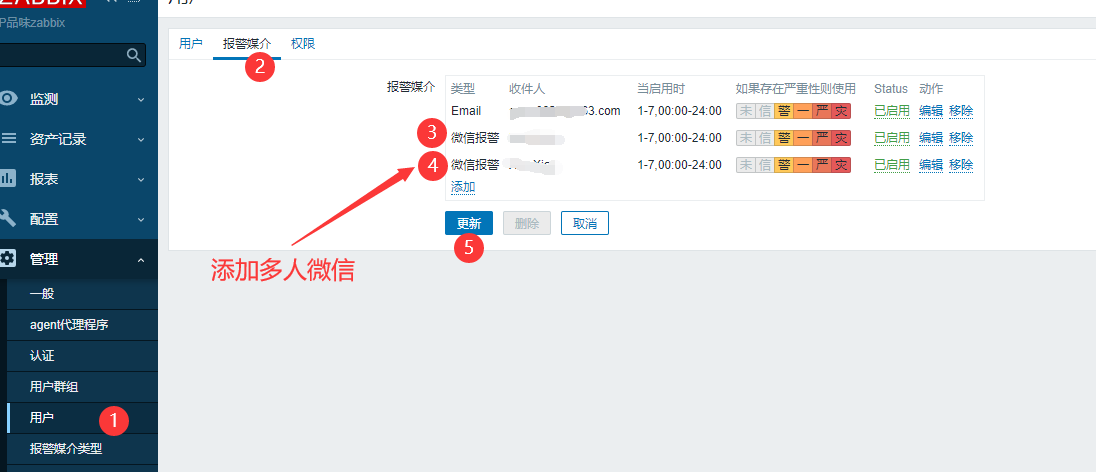
5:测试报警
10:自定义图形和grafana出图
#安装grafana
wget https://mirror.tuna.tsinghua.edu.cn/grafana/yum/rpm/grafana-7.3.1-1.x86_64.rpm
yum localinstall grafana-7.3.1-1.x86_64.rpm -y
systemctl start grafana-server.service
systemctl enable grafana-server.service
netstat -lntup
#granfa的概念
插件
数据源
dashboard
11∶自定义监控模板
#监控tcp的11种状态
ESTABLISHED
SYN_SENT
SYN_RECV
FIN_WAIT1
FIN_WAIT2
TIME_WAIT
CLOSE
CLOSE_WAIT
LAST_ACK
LISTEN
CLOSING
12:zabbix监控角度总结
zabbix 4.0监控nginx
1:导入模板,测试下模板的兼容性
2:把模板取值的配置文件和脚本,放在对应的位置
3:zabbix-get测试取值
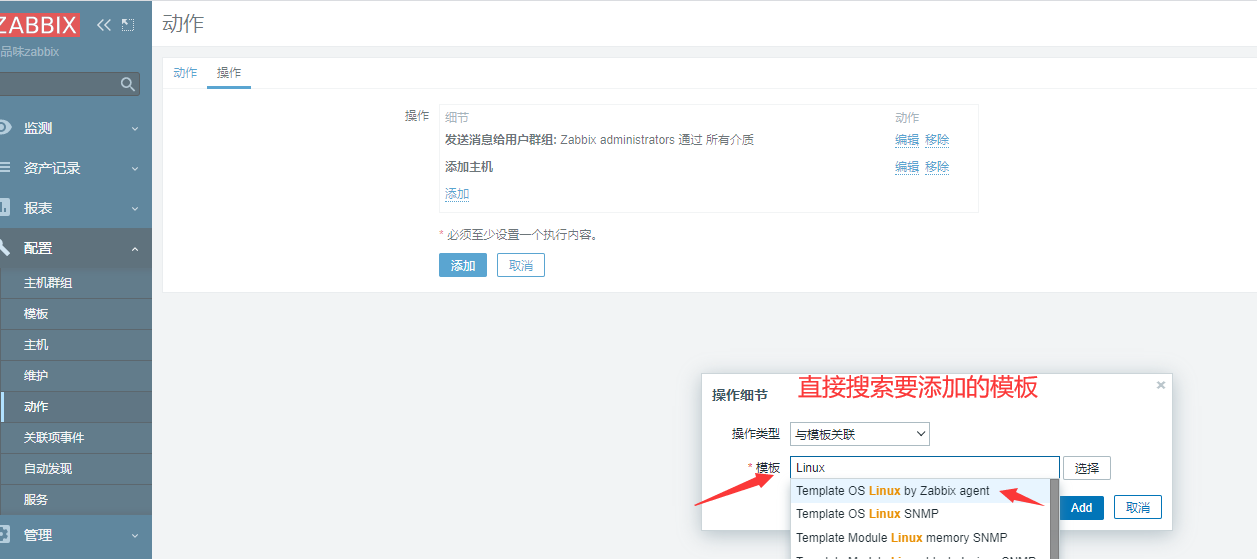
4:给主机链接模板
13: web网站的可用性监测
https://www.cnblogs.com/michael2018/p/13994045.html
#实现 curl 模拟登陆 报警
14:使用percona插件监控mysql
15: snmp监控window和Linux
16: zabbix自动发现和自动注册(主动)
自动发现
#自动发现:自动化添加监控主机
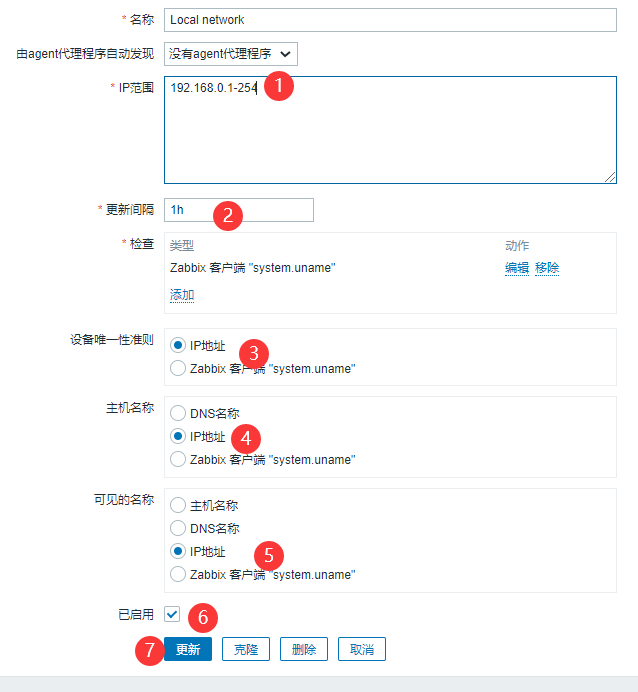
1.配置扫描网段范围 例如:192.168.0.100-200
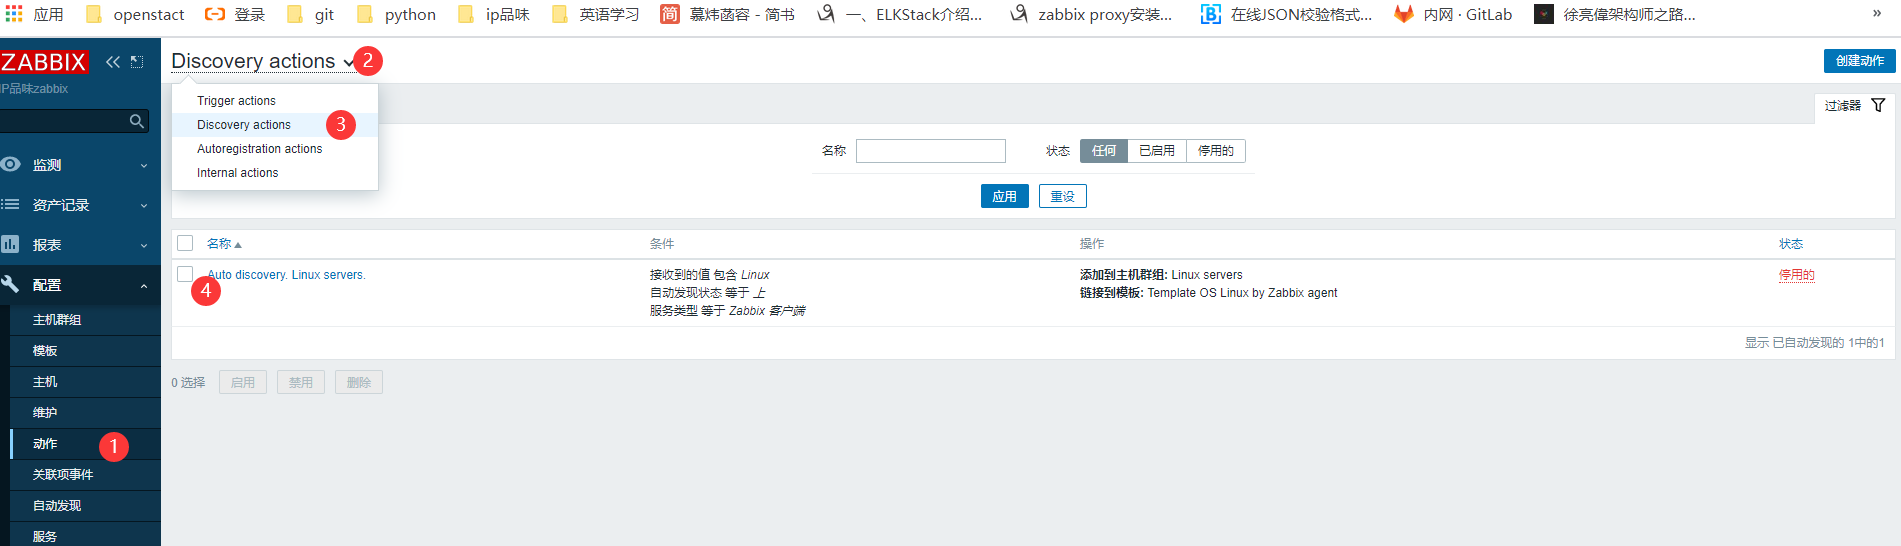
2.配置扫描动作
3.被监控的主机需要安装配置启动agent
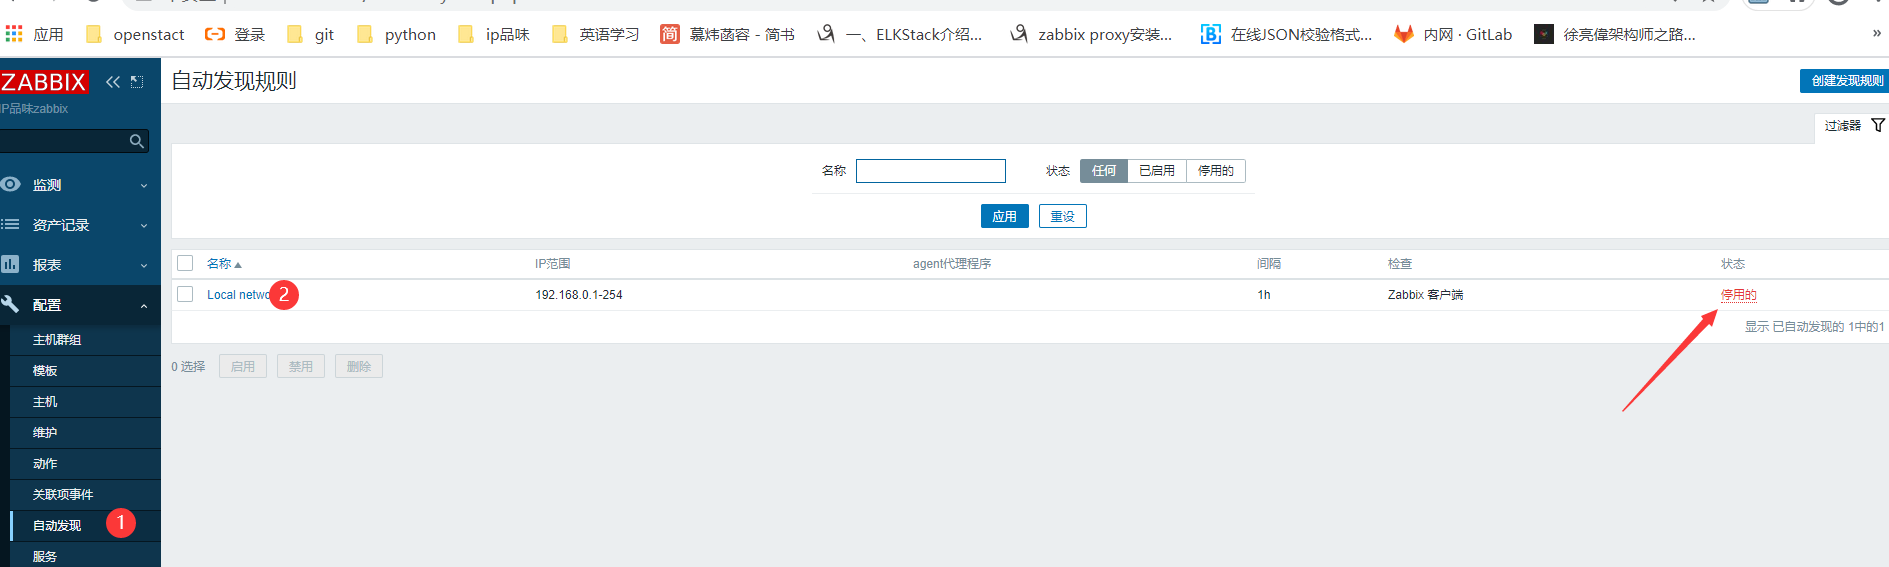
配置自动发现规则,注意配置IP地址范围,zabbix客户端去探测 system.uname进行判断添加
配置动作:注意规则
条件:接收到的值 包含 Linux
自动发现状态 等于 上
服务类型 等于 Zabbix 客户端 #必须安装agent
```


安装被监控主机,配置被监控主机
```bash
rpm -ivh https://mirror.tuna.tsinghua.edu.cn/zabbix/zabbix/5.0/rhel/7/x86_64/zabbix-agent2-5.0.5-1.el7.x86_64.rpm
vim /etc/zabbix/zabbix_agent2.conf
Server=10.0.0.71 #配置zabbix-server主机IP地址
systemctl start zabbix-agent2.service
systemctl enable zabbix-agent2.service
自动注册(主动模式)
#主动注册注意配置被监控端配置
Server=允许取值的IP地址
ServerActive= 主动找server IP地址
Hostname= 被监控主机的主机名或者直接填写IP地址
HostMetadata= web|DB|cache  根据主机用途作为标识,例如有web主机链接Nginx模板,db链接数据库(mysql)模板
自动注册的规则server端,配置自动注册的规则。
HostMetadata=
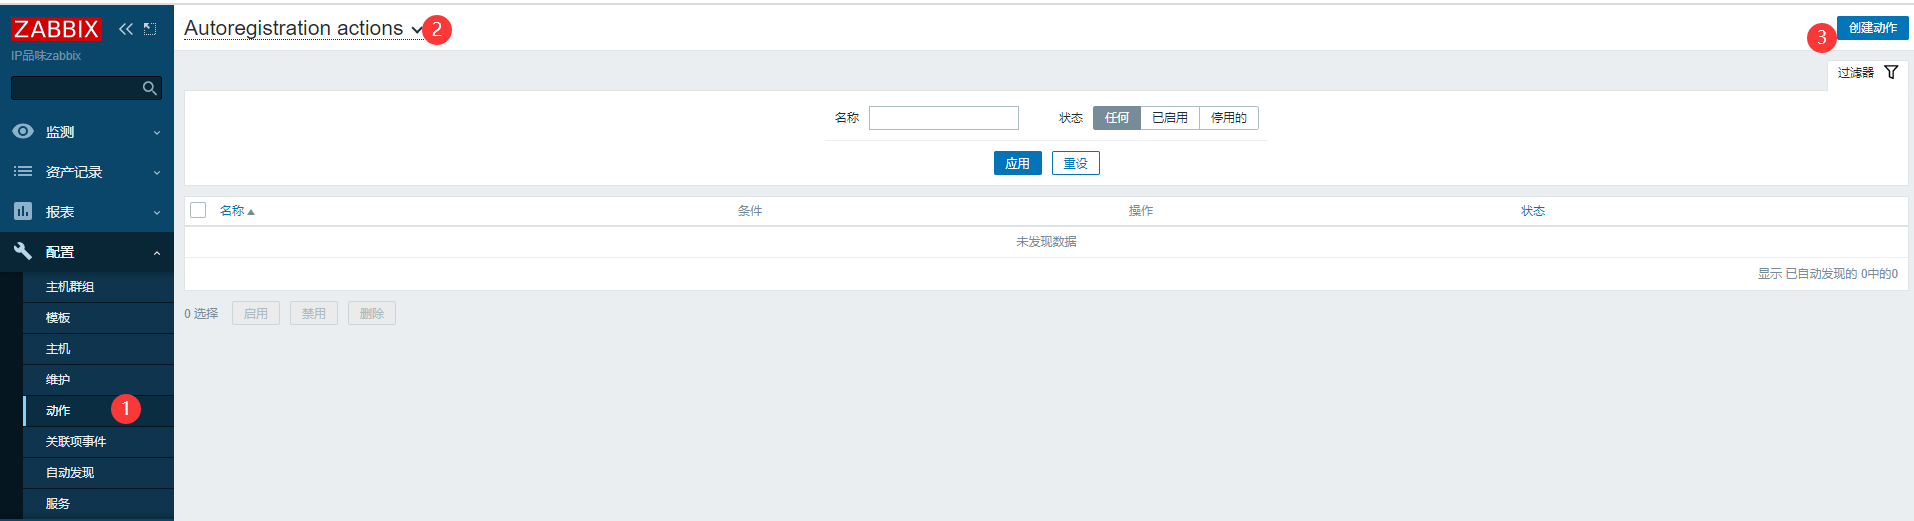
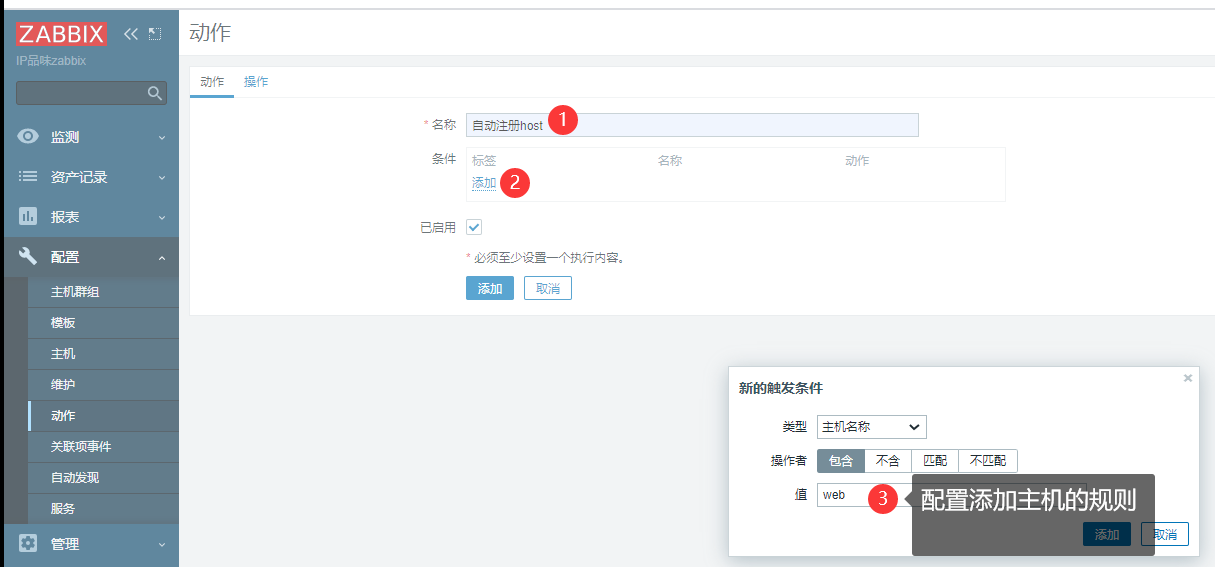
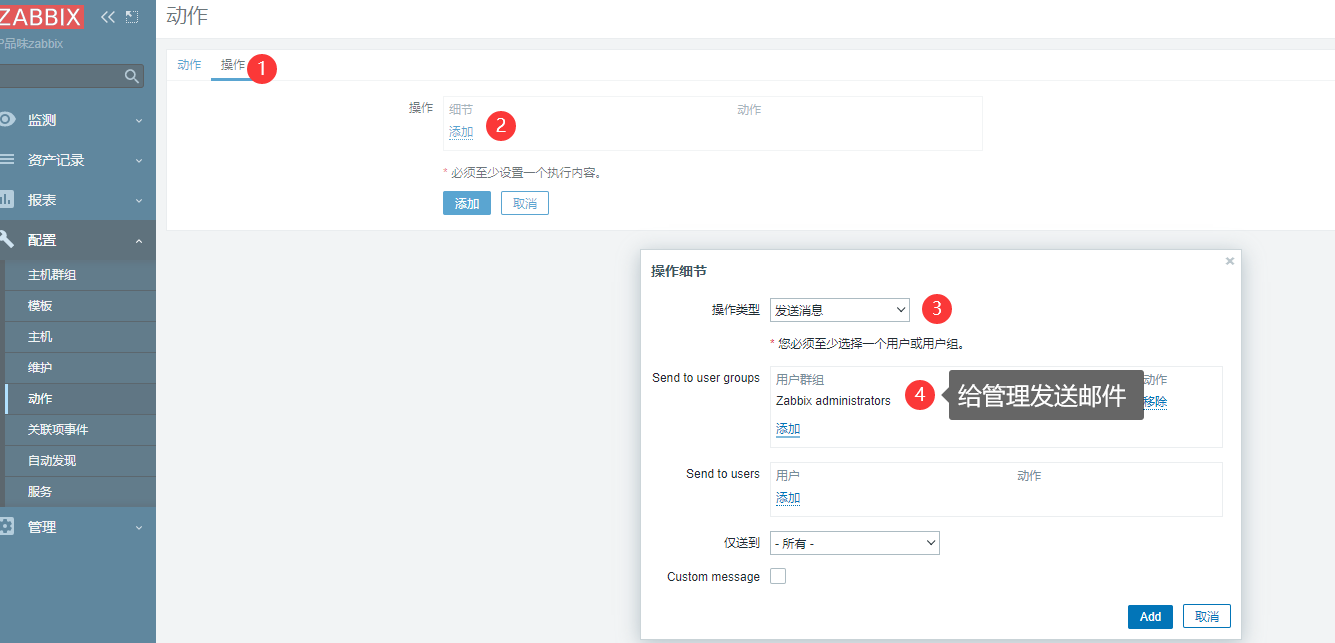
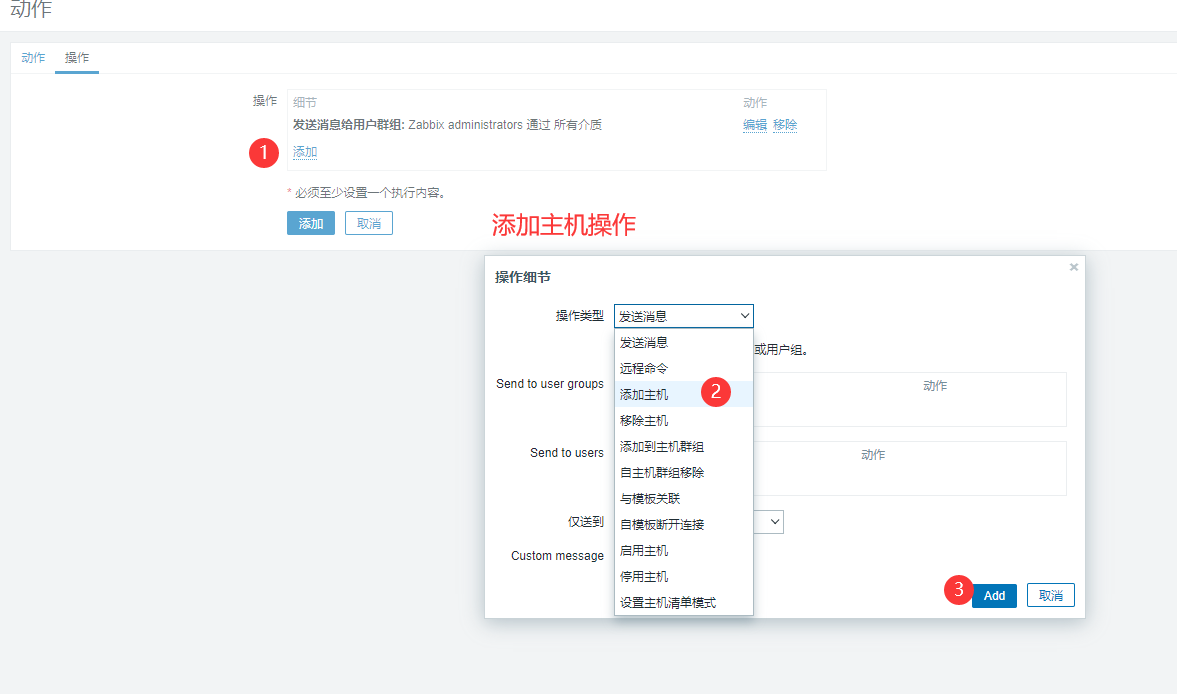
配置操作

17: zabbix-agent主动和被动的区别
18: zabbix版本升级
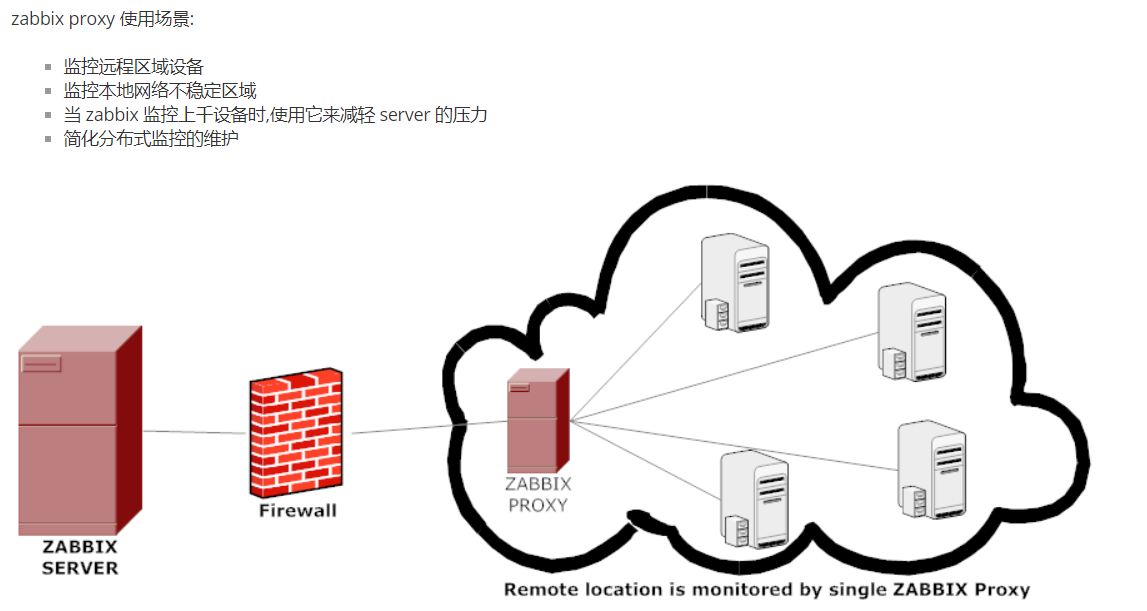
19: zabbix分布式监控proxy

#安装zabbix
wget https://mirror.tuna.tsinghua.edu.cn/zabbix/zabbix/5.0/rhel/7/x86_64/zabbix-release-5.0-1.el7.noarch.rpm
rpm -ivh zabbix-release-5.0-1.el7.noarch.rpm
cd /etc/yum.repos.d/
curl -o /etc/yum.repos.d/CentOS-Base.repo http://mirrors.aliyun.com/repo/Centos-7.repo

mysql_secure_installation
mysql
MariaDB [(none)]> create database zabbix character set utf8 collate utf8_bin;
Query OK, 1 row affected (0.00 sec)
MariaDB [(none)]> grant all privileges on zabbix.* to 'zabbix'@'localhost' identified by '123456';
Query OK, 0 rows affected (0.00 sec)
#被监控主机
rpm -ivh https://mirror.tuna.tsinghua.edu.cn/zabbix/zabbix/5.0/rhel/7/x86_64/zabbix-agent2-5.0.5-1.el7.x86_64.rpm
vim /etc/zabbix/zabbix_agent2.conf
Server=10.0.0.71  #配置zabbix-server主机IP地址
systemctl start zabbix-agent2.service
systemctl enable zabbix-agent2.service

 浙公网安备 33010602011771号