

Python(折线图)
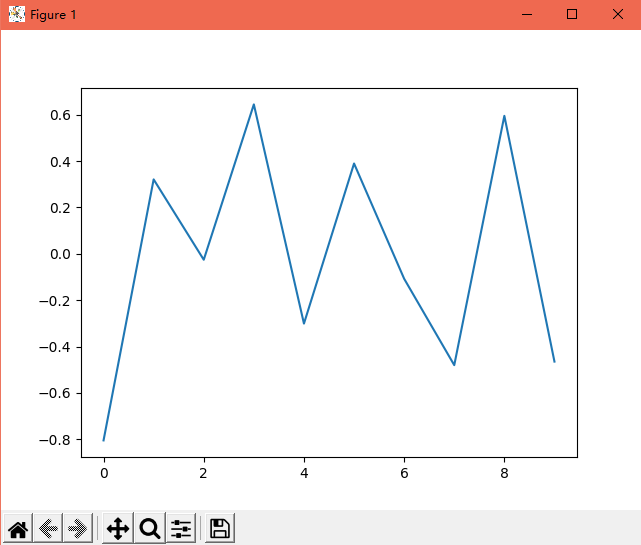
一、用 Numpy ndarray 作为数据传入 ply
代码:
 1 import numpy as np
 2 import matplotlib.pyplot as plt
 3
 4 np.random.seed(1000)
 5 y = np.random.standard_normal(10)
 6 print
 7 "y = %s" % y
 8 x = range(len(y))
 9 print
10 "x=%s" % x
11 plt.plot(y)
12 plt.show()
效果:
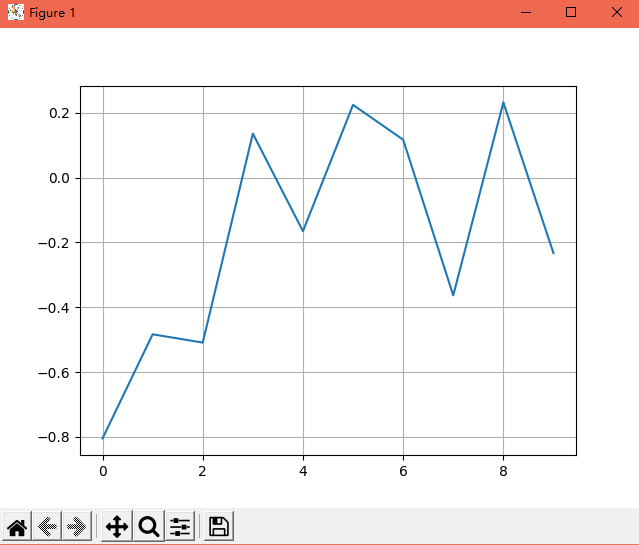
二、操纵坐标轴和增加网格及标签的函数
代码:
1 import numpy as np
2 import matplotlib.pyplot as plt
3
4 np.random.seed(1000)
5 y = np.random.standard_normal(10)
6 plt.plot(y.cumsum())
7 plt.grid(True)  # 增加格点
8 plt.axis('tight')  # 坐标轴适应数据量 axis 设置坐标轴
9 plt.show()
效果:
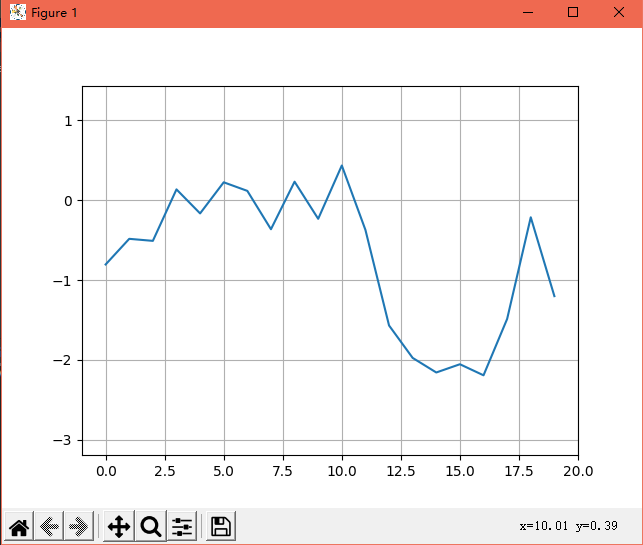
三、plt.xlim 和 plt.ylim 设置每个坐标轴的最小值和最大值
代码:
 1 import numpy as np
 2 import matplotlib.pyplot as plt
 3
 4 np.random.seed(1000)
 5 y = np.random.standard_normal(20)
 6 plt.plot(y.cumsum())
 7 plt.grid(True)  # 增加格点
 8 plt.xlim(-1, 20)
 9 plt.ylim(np.min(y.cumsum()) - 1, np.max(y.cumsum()) + 1)
10
11 plt.show()
效果:
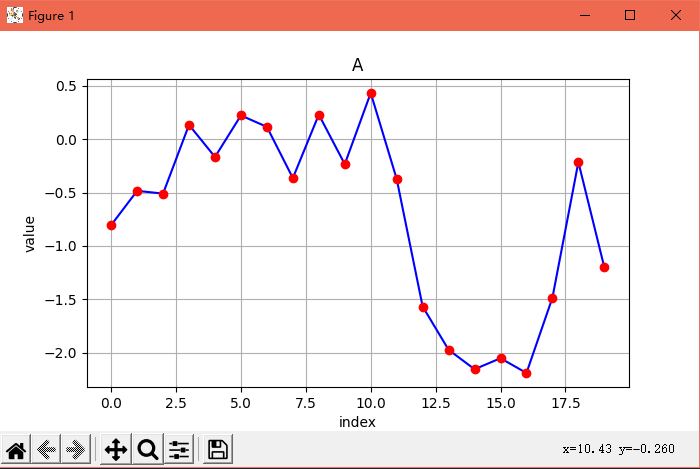
四、添加标题和标签 plt.title, plt.xlabe, plt.ylabel 离散点, 线
代码:
 1 import numpy as np
 2 import matplotlib.pyplot as plt
 3
 4 np.random.seed(1000)
 5 y = np.random.standard_normal(20)
 6
 7 plt.figure(figsize=(7, 4))  # 画布大小
 8 plt.plot(y.cumsum(), 'b', lw=1.5)  # 蓝色的线
 9 plt.plot(y.cumsum(), 'ro')  # 离散的点
10 plt.grid(True)
11 plt.axis('tight')
12 plt.xlabel('index')
13 plt.ylabel('value')
14 plt.title('A')
15 plt.show()
效果:
参考链接:Python 绘制可视化折线图
