
通过Echarts来实现柱状图及折线图的可视化
| 每日日报18 | 3月18日 |
| 所花时间(包括上课) | 5小时 |
| 代码量(行) | 182 |
| 博客量(篇) | 2 |
| 了解到的知识点 | Echarts柱状图、折线图 |
柱状图效果图如下:
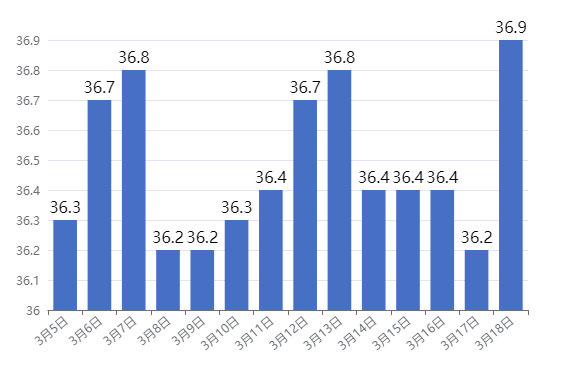
其中日期数据以及温度数据均从数据库中读取的,至于如何读取的,便不做过多的展示了
代码如下:
 1 <%@ taglib prefix="c" uri="http://java.sun.com/jsp/jstl/core" %>
 2 <%@ page language="java" contentType="text/html; charset=UTF-8"
 3     pageEncoding="UTF-8"%>
 4 <!DOCTYPE html>
 5 <html>
 6 <head>
 7 <meta charset="UTF-8">
 8 <title>show</title>
 9 <!-- 使用单文件引入的方式使用echarts.min.jS -->
10 <script src="js/echarts.min.js"></script>
11 <!-- 官网jQuery文件  -->
12 <script src="https://code.jquery.com/jquery-3.6.0.min.js"></script>
13 </head>
14 <body>
15 <div id="main" style="width: 600px;height:400px;"></div>
16     <script type="text/javascript">
17         // 基于准备好的dom,初始化echarts实例
18         var chartDom = document.getElementById('main');
19         var myChart = echarts.init(chartDom);
20         var option;
21         var arr = new Array();
22         <c:forEach items="${list}" var="temperature">//此处为自己从数据库中所查找得到的数据,不再做相关展示
23             arr[0] = ${temperature.temperature1};
24             arr[1] = ${temperature.temperature2};
25             arr[2] = ${temperature.temperature3};
26             arr[3] = ${temperature.temperature4};
27             arr[4] = ${temperature.temperature5};
28             arr[5] = ${temperature.temperature6};
29             arr[6] = ${temperature.temperature7};
30             arr[7] = ${temperature.temperature8};
31             arr[8] = ${temperature.temperature9};
32             arr[9] = ${temperature.temperature10};
33             arr[10] = ${temperature.temperature11};
34             arr[11] = ${temperature.temperature12};
35             arr[12] = ${temperature.temperature13};
36             arr[13] = ${temperature.temperature14};
37            </c:forEach>
38         option = {
39             xAxis: {
40                 type: 'category',
41                 data: [
42                     <c:forEach items="${list}" var="temperature">
43                     ["${temperature.date1}"],
44                     ["${temperature.date2}"],
45                     ["${temperature.date3}"],
46                     ["${temperature.date4}"],
47                     ["${temperature.date5}"],
48                     ["${temperature.date6}"],
49                     ["${temperature.date7}"],
50                     ["${temperature.date8}"],
51                     ["${temperature.date9}"],
52                     ["${temperature.date10}"],
53                     ["${temperature.date11}"],
54                     ["${temperature.date12}"],
55                     ["${temperature.date13}"],
56                     ["${temperature.date14}"],
57                        </c:forEach>
58                 ],
59                 axisLabel: {
60                     interval:0,  //坐标刻度之间的显示间隔,默认就可以了(默认是不重叠)
61                     rotate:40,  //调整数值改变倾斜的幅度(范围-90到90)
62                    },
63             },
64             yAxis: {
65                 type: 'value',
66                 min:36.0,
67                 max:36.9,
68                 interval: 0.1,
69             },
70             series: [{
71                 data:arr,
72                 text:'温度',
73                 type: 'bar',
74                 itemStyle: {
75                     normal: {
76                         label: {
77                             show: true, //开启显示
78                             position: 'top', //在上方显示
79                             textStyle: { //数值样式
80                                 color: 'black',
81                                 fontSize: 16
82                             }
83                         }
84                     }
85                 },
86             }],
87         };
88         option && myChart.setOption(option);
89     </script>
90 </body>
91 </html>
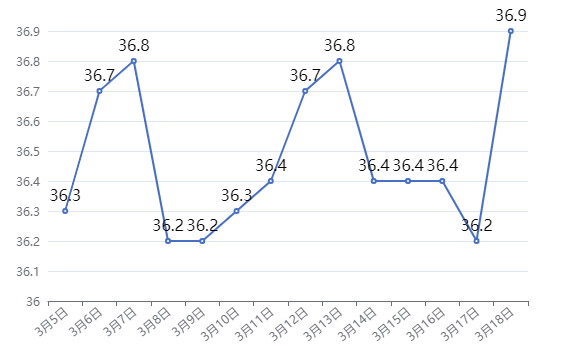
折线图效果如下:
代码如下:
 1 <%@ taglib prefix="c" uri="http://java.sun.com/jsp/jstl/core" %>
 2 <%@ page language="java" contentType="text/html; charset=UTF-8"
 3     pageEncoding="UTF-8"%>
 4 <!DOCTYPE html>
 5 <html>
 6 <head>
 7 <meta charset="UTF-8">
 8 <title>show</title>
 9 <!-- 使用单文件引入的方式使用echarts.min.jS -->
10 <script src="js/echarts.min.js"></script>
11 <!-- 官网jQuery文件  -->
12 <script src="https://code.jquery.com/jquery-3.6.0.min.js"></script>
13 </head>
14 <body>
15 <div id="zhexian" style="width: 600px;height:400px;"></div>
16     <script type="text/javascript">
17         // 基于准备好的dom,初始化echarts实例
18         var chartDom = document.getElementById('zhexian');
19         var myChart = echarts.init(chartDom);
20         var option;
21         var arr = new Array();
22         <c:forEach items="${list}" var="temperature">
23             arr[0] = ${temperature.temperature1};
24             arr[1] = ${temperature.temperature2};
25             arr[2] = ${temperature.temperature3};
26             arr[3] = ${temperature.temperature4};
27             arr[4] = ${temperature.temperature5};
28             arr[5] = ${temperature.temperature6};
29             arr[6] = ${temperature.temperature7};
30             arr[7] = ${temperature.temperature8};
31             arr[8] = ${temperature.temperature9};
32             arr[9] = ${temperature.temperature10};
33             arr[10] = ${temperature.temperature11};
34             arr[11] = ${temperature.temperature12};
35             arr[12] = ${temperature.temperature13};
36             arr[13] = ${temperature.temperature14};
37            </c:forEach>
38         option = {
39             xAxis: {
40                 type: 'category',
41                 data: [
42                     <c:forEach items="${list}" var="temperature">
43                     ["${temperature.date1}"],
44                     ["${temperature.date2}"],
45                     ["${temperature.date3}"],
46                     ["${temperature.date4}"],
47                     ["${temperature.date5}"],
48                     ["${temperature.date6}"],
49                     ["${temperature.date7}"],
50                     ["${temperature.date8}"],
51                     ["${temperature.date9}"],
52                     ["${temperature.date10}"],
53                     ["${temperature.date11}"],
54                     ["${temperature.date12}"],
55                     ["${temperature.date13}"],
56                     ["${temperature.date14}"],
57                        </c:forEach>
58                 ],
59                 axisLabel: {
60                     interval:0,  //坐标刻度之间的显示间隔,默认就可以了(默认是不重叠)
61                     rotate:40,  //调整数值改变倾斜的幅度(范围-90到90)
62                    },
63             },
64             yAxis: {
65                 type: 'value',
66                 min:36.0,
67                 max:36.9,
68                 interval: 0.1,
69             },
70             series: [{
71                 data:arr,
72                 text:'温度',
73                 type: 'line',
74                 itemStyle: {
75                     normal: {
76                         label: {
77                             show: true, //开启显示
78                             position: 'top', //在上方显示
79                             textStyle: { //数值样式
80                                 color: 'black',
81                                 fontSize: 16
82                             }
83                         }
84                     }
85                 },
86             }],
87         };
88         option && myChart.setOption(option);
89     </script>
90 </body>
91 </html>

 浙公网安备 33010602011771号