echarts实现可动折线图
可动折线图
建议:让产品、ui设计结合多张图做联动渲染,这个可动折线图才有意义
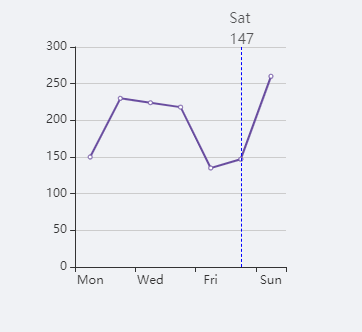
效果预览
具体实现
实现:线和值都是css定位到画布,核心就是设置定时器并通过获取
tooltip点击事件获取到点击位置的dataIndex,并且通过echarts的api:convertToPixel,可转换坐标系上的点到像素坐标值,最后通过定位即可。
- 上代码:
<!--
 * @Description:
 * @Version: 2.0
 * @Autor: 王敏
 * @Date: 2021-07-14 15:20:09
 * @LastEditors: 王敏
 * @LastEditTime: 2021-07-20 14:20:37
-->
<template>
  <div class="myPage">
    <div class="line1">
      <div
        id="line1"
        class="chart"
      />
      <div
        v-if="lineObj.toLeft"
        class="indicateLine"
        :style="{left:lineObj.toLeft}"
      >
        <div class="describe">
          <p>{{ lineObj.x }}</p>
          <p>{{ lineObj.y }}</p>
        </div>
      </div>
    </div>
  </div>
</template>

<script>
import * as echarts from 'echarts'
export default {
  data () {
    return {
      lineChart1: null,
      lineObj: {},
      lineData: [
        {
          x: 'Mon',
          y: 150
        },
        {
          x: 'Tue',
          y: 230
        },
        {
          x: 'Wed',
          y: 224
        },
        {
          x: 'Thu',
          y: 218
        },
        {
          x: 'Fri',
          y: 135
        },
        {
          x: 'Sat',
          y: 147
        },
        {
          x: 'Sun',
          y: 260
        }
      ],
      lineTimer: null
    }
  },
  mounted () {
    this.drawLine('line1')
  },
  beforeDestroy () {
    if (this.lineTimer) clearInterval(this.lineTimer)
  },
  methods: {
    drawLine (id) {
      const myChart = echarts.init(document.getElementById(id))
      const { lineData } = this
      const x = []
      const y = []
      lineData.forEach(v => {
        x.push(v.x)
        y.push(v.y)
      })
      const option = {
        color: ['#694d9f'],
        xAxis: {
          type: 'category',
          data: x
        },
        grid: {
          top: 30,
          bottom: 30,
          containLabel: true
        },
        yAxis: {
          type: 'value'
        },
        tooltip: {
          trigger: 'axis',
          triggerOn: 'click',
          formatter: () => '',
          position: (p, dataArr) => {
            const { dataIndex } = dataArr[0]
            this.beatLine(dataIndex)
            return [0, 0]
          }
        },
        series: [{
          data: y,
          type: 'line'
        }]
      }
      myChart.setOption(option, true)
      this.lineChart1 = myChart
      this.beatLine(0)
    },
    beatLine (index) {
      const { lineData, lineTimer } = this
      if (lineTimer) clearInterval(lineTimer)
      const len = lineData.length
      this.lineFun(index)
      this.lineTimer = setInterval(() => {
        index++
        if (index > len - 1) index = 0
        this.lineFun(index)
      }, 2000)
    },
    lineFun (index) {
      const { lineChart1, lineData } = this
      const toLeft = lineChart1.convertToPixel({ xAxisIndex: 0 }, index)
      this.lineObj = {
        toLeft: toLeft + 'px',
        x: lineData[index].x,
        y: lineData[index].y
      }
    }
  }
}

</script>
<style lang='less' scoped src="./css/beatLine.less"/>

 浙公网安备 33010602011771号