
echarts地图配置
echarts地图配置
仓库地址:
注:建议使用
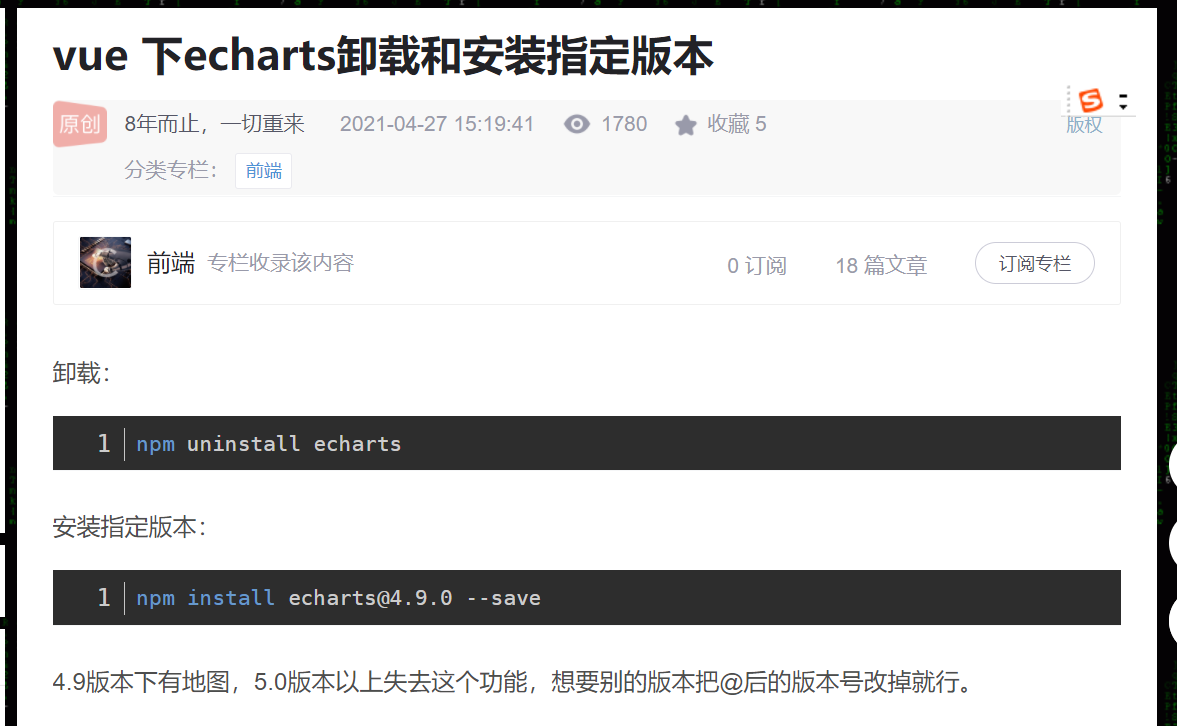
echarts绘制地图安装4.9版本的,5.x的select选中指令能调到你头秃
yarn remove echarts   //卸载echarts
yarn add echarts@4.9.0 --save    //安装4.9版本echarts
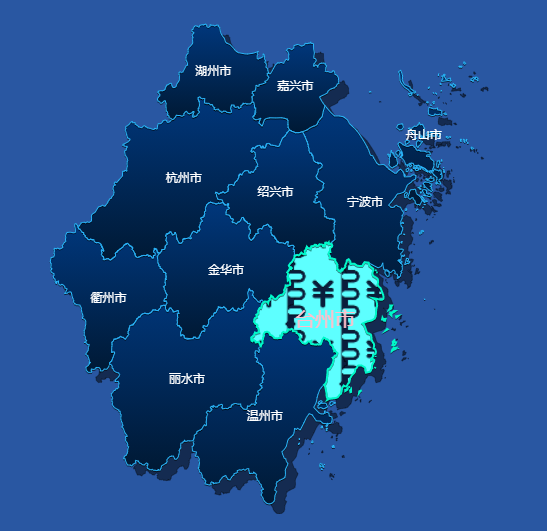
地图贴图、点击事件(tooltip触发)、选中、未选中等配置
功能描述:该页面可配置区块
未选中、高亮情况下的贴图、区块颜色、边框颜色、地图阴影,文字颜色等的配置,并添加点击事件可以获取区块名称
效果预览
核心代码
   // 地图贴图
    makeImg () {
      const domImg = document.createElement('img')
      domImg.style.height = domImg.height = domImg.width = domImg.style.width = '8px'
      domImg.src =
          'https://z3.ax1x.com/2021/07/16/WKMOSA.png'
      this.domImg = domImg
    },
    initMap (id) {
      echarts.registerMap('zhejiang', zhejiang) // 在echarts中注册地图,zhejiang是挂在window上的全局变量,后期建议由后台讲json传到前端
      const { domImg } = this
      const myChart = echarts.init(document.getElementById(id))
      const option = {
        tooltip: {
          trigger: 'item',
          triggerOn: 'click', // 将出发条件改为click,避免mousemove频繁触发
          formatter (a, b) {
            console.log('名字', a.name)
            return ''
          }
        },
        geo: {
          type: 'map', // 类型
          map: 'zhejiang', // 地图名
          show: true, // 是否显示地图
          roam: true, // 支持鼠标缩放和移动
          zoom: 1.2, // 地图放大1.2倍
          itemStyle: { // 对地图底图进行阴影配置,项目需求没有不要也罢,有了这个geo和map的roam必须为false不然会分离
            normal: { // 一般情况,这里没有罗列底图高亮因为底图的高亮完全没有必要,我们是对地图操作,底图只是伪2d效果
              areaColor: 'rgba(0, 15, 40, 0.5)', // 区块颜色
              shadowColor: 'rgba(0, 0, 0, 1)', // 阴影颜色
              shadowBlur: 0, // 阴影模糊度
              shadowOffsetX: 10, // 阴影x轴偏移距离
              shadowOffsetY: 10, // 阴影y轴偏移距离
              borderColor: 'rgba(0, 0, 0, 0.7)', // 多边形边框颜色
              borderWidth: 0.5 // 多边形边框宽度
            }
          }
        },
        series: [
          {
            type: 'map',
            map: 'zhejiang',
            // geoIndex: 1,
            roam: true, // 支持鼠标缩放和移动
            zoom: 1.2, // 地图放大1.2倍
            label: { // 文字设置
              normal: { // 未选中下
                show: true,
                textStyle: {
                  color: '#fff'
                }
              },
              emphasis: { // 高亮下
                textStyle: {
                  color: 'pink',
                  fontSize: 20
                }
              }
            },
            itemStyle: { // 区块设置
              normal: { // 未选中下
                borderColor: '#2ab8ff',
                borderWidth: 1,
                areaColor: {
                  type: 'linear',
                  x: 0,
                  y: 1,
                  x2: 0,
                  y2: 0,
                  colorStops: [{
                    offset: 0,
                    color: '#001934' // 0% 处的颜色
                  },
                  {
                    offset: 1,
                    color: '#00377C' // 100% 处的颜色
                  }],
                  global: false // 缺省为 false
                },
                shadowColor: 'rgba(0, 0, 0, 0.5)',
                shadowBlur: 0,
                shadowOffsetX: 0,
                shadowOffsetY: 1
              },
              emphasis: { // 高亮状态下的样式
                areaColor: {
                  image: domImg,
                  repeat: 'repeat'
                },
                borderColor: '#00F8C9',
                borderWidth: 2
              }
            }
          }
        ]

      }
      myChart.setOption(option, true)
    }
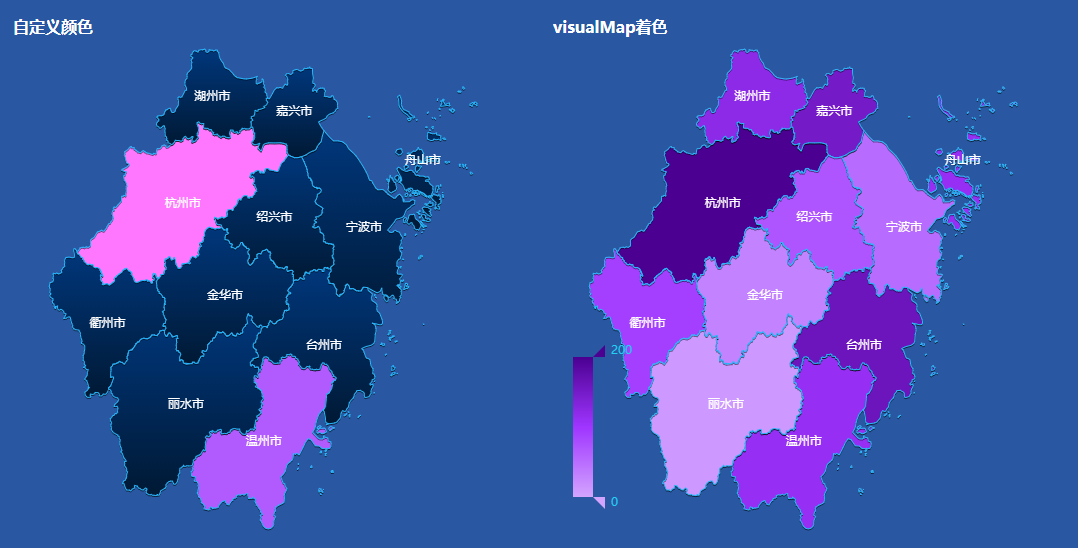
地图颜色填充+点击事件(echarts触发)
效果预览
具体实现
-
自定义颜色+点击事件
- 自定义颜色
自定义颜色实现思路:需要将
series中map的geoIndex设置为0(即把地图上面的图层关掉),然后对geo进行图层设置(去除掉了series的地图图层就会展示地图geo中的设置,那些个label、itemStyle都在geo中配置),并在geo中添加regions数组(后面会贴代码),改数组会对指定区域进行颜色配置- 点击事件
点击事件实现思路:不同于上面
tooltip加点击事件,这里讲的是在echarts中添加点击事件点击事件想要获取到数据,需要在series中map的data设置值(name为注入echarts地图的名字,其他数据根据需求来)- 上代码
data () { return { cityData: [ { name: '杭州市', value: 200, describe: 'base In hangzhou' }, { name: '宁波市', value: 51 }, { name: '温州市', value: 111 }, { name: '绍兴市', value: 71 }, { name: '湖州市', value: 121 }, { name: '嘉兴市', value: 151 }, { name: '金华市', value: 31 }, { name: '衢州市', value: 91 }, { name: '台州市', value: 161 }, { name: '丽水市', value: 11 }, { name: '舟山市', value: 111 } ] } }, // 自定义颜色 initMap (id) { const { cityData } = this echarts.registerMap('zhejiang', zhejiang) const myChart = echarts.init(document.getElementById(id)) const option = { tooltip: { trigger: 'item', triggerOn: 'click', enterable: true, backgroundColor: 'opacity', extraCssText: 'z-index:2', formatter (a, b) { console.log('名字', a.name) return '' } }, geo: { type: 'map', map: 'zhejiang', roam: true, // 支持鼠标缩放和移动 zoom: 1.2, // 地图放大1.2倍 label: { // 文字设置 normal: { // 未选中下 show: true, textStyle: { color: '#fff', fontSize: 12 } }, emphasis: { // 高亮下 textStyle: { color: 'pink', fontSize: 20 } } }, itemStyle: { // 区块设置 normal: { // 未选中下 borderColor: '#2ab8ff', borderWidth: 1, areaColor: { type: 'linear', x: 0, y: 1, x2: 0, y2: 0, colorStops: [{ offset: 0, color: '#001934' // 0% 处的颜色 }, { offset: 1, color: '#00377C' // 100% 处的颜色 }], global: false // 缺省为 false }, shadowColor: 'rgba(0, 0, 0, 0.5)', shadowBlur: 0, shadowOffsetX: 0, shadowOffsetY: 1 }, emphasis: { // 高亮状态下的样式 areaColor: '#206474', borderColor: '#00F8C9', borderWidth: 2 } }, regions: [ // 对不同的区块进行着色 { name: '杭州市', itemStyle: { normal: { areaColor: '#FF77FF' }, emphasis: { areaColor: '#AE00AE' } } }, { name: '温州市', itemStyle: { normal: { areaColor: '#B15BFF' }, emphasis: { areaColor: '#6F00D2' } } } ] }, series: [ { type: 'map', map: 'zhejiang', geoIndex: 0, data: cityData } ] } myChart.on('click', (param) => { //这里进行点击事件,param.data为series里头data传入的数据 console.log('params', param.data) }) myChart.setOption(option, true) }, -
visualMap着色
- 实现思路
visualMap着色实现思路:series中map需带name、value值,本质根据value大小进行着色,需在options中添加visualMap,进行最大、最小、颜色等的配置,达到我们想要的效果
- 贴代码
data () {
    return {
      cityData: [
        { name: '杭州市', value: 200, describe: 'base In hangzhou' },
        { name: '宁波市', value: 51 },
        { name: '温州市', value: 111 },
        { name: '绍兴市', value: 71 },
        { name: '湖州市', value: 121 },
        { name: '嘉兴市', value: 151 },
        { name: '金华市', value: 31 },
        { name: '衢州市', value: 91 },
        { name: '台州市', value: 161 },
        { name: '丽水市', value: 11 },
        { name: '舟山市', value: 111 }
      ]
    }
  },
// visualMap着色
    initMap2 (id) {
      const { cityData } = this
      echarts.registerMap('zhejiang', zhejiang)
      const myChart = echarts.init(document.getElementById(id))
      const option = {
        tooltip: {
          trigger: 'item',
          triggerOn: 'click',
          enterable: true,
          backgroundColor: 'opacity',
          extraCssText: 'z-index:2',
          formatter (a, b) {
            console.log('名字', a.name)
            return ''
          }
        },
        visualMap: {
          min: 0,
          max: 200,
          left: '3%',
          bottom: '5%',
          calculable: true,
          seriesIndex: [0], // 指定取哪个系列的数据,即哪个系列的 series.data
          inRange: {
            color: ['#d3a4ff', '#9F35FF', '#4B0091']
          },
          textStyle: {
            color: '#24CFF4'
          }
        },
        geo: {
          type: 'map',
          map: 'zhejiang',
          roam: true, // 支持鼠标缩放和移动
          zoom: 1.2 // 地图放大1.2倍
        },
        series: [
          {
            type: 'map',
            map: 'zhejiang',
            zoom: 1.2,
            label: { // 文字设置
              normal: { // 未选中下
                show: true,
                textStyle: {
                  color: '#fff',
                  fontSize: 12
                }
              },
              emphasis: { // 高亮下
                textStyle: {
                  color: 'pink',
                  fontSize: 20
                }
              }
            },
            itemStyle: { // 区块设置
              normal: { // 未选中下
                borderColor: '#2ab8ff',
                borderWidth: 1,
                areaColor: {
                  type: 'linear',
                  x: 0,
                  y: 1,
                  x2: 0,
                  y2: 0,
                  colorStops: [{
                    offset: 0,
                    color: '#001934' // 0% 处的颜色
                  },
                  {
                    offset: 1,
                    color: '#00377C' // 100% 处的颜色
                  }],
                  global: false // 缺省为 false
                },
                shadowColor: 'rgba(0, 0, 0, 0.5)',
                shadowBlur: 0,
                shadowOffsetX: 0,
                shadowOffsetY: 1
              },
              emphasis: { // 高亮状态下的样式
                areaColor: '#206474',
                borderColor: '#00F8C9',
                borderWidth: 2
              }
            },
            data: cityData
          }
        ]

      }
      myChart.on('click', (param) => {
        console.log('params', param.data)
      })
      myChart.setOption(option, true)
    }
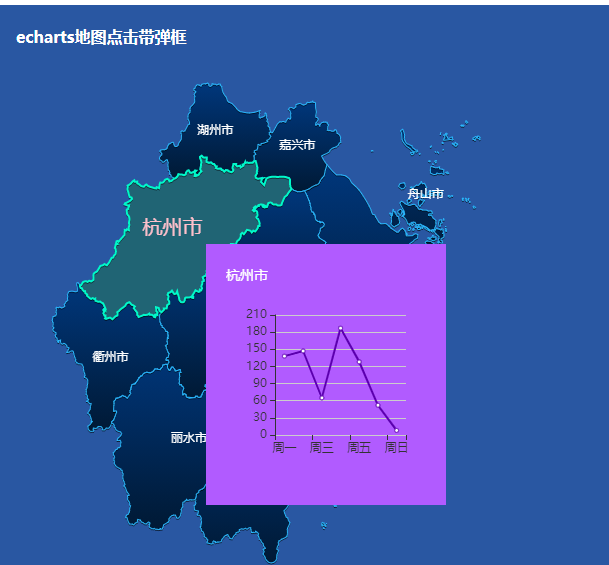
echarts弹框(组件引入弹框)
效果预览
具体实现
- 先写一个弹框组件
<template>
  <div class="popDemo1">
    {{ name }}
    <div
      id="lineChart"
      class="chart"
    />
  </div>
</template>

<script>
import * as echarts from 'echarts'
export default {
  props: {
    name: {
      type: String,
      default () {
        return ''
      }
    },
    lineData: {
      type: Object,
      default () {
        return {
          x: [],
          y: []
        }
      }
    }
  },
  data () {
    return {

    }
  },
  mounted () {
    setTimeout(() => {
      this.lineChart('lineChart', this.lineData)
    }, 0)
  },
  methods: {
    lineChart (id, data) {
      const { x, y } = data
      const myChart = echarts.init(document.getElementById(id))
      const option = {
        color: '#5B00AE',
        xAxis: {
          type: 'category',
          axisLine: {
            show: false
          },
          splitLine: {
            show: false
          },
          data: x
        },
        grid: {
          top: 30,
          bottom: 30,
          containLabel: true
        },
        yAxis: {
          type: 'value'
        },
        tooltip: {
          trigger: 'axis'
        },
        series: [{
          type: 'line',
          data: y
        }]
      }
      myChart.setOption(option, true)
    }
  }
}

</script>
<style lang='less' scoped>
.popDemo1{
  padding:20px;
  background: #B15BFF;
  .chart{
    width:200px;
    height: 200px;
  }
}
</style>
- 再在需要用的地方引入
import popDemo1 from '@/components/pop/popDemo1'
import Vue from 'vue'
- 具体调用处的
tooltip中引入popDemo1组件导出html代码块
initMap (id) {
      const { cityData } = this
      echarts.registerMap('zhejiang', zhejiang)
      const myChart = echarts.init(document.getElementById(id))
      const option = {
        tooltip: {
          trigger: 'item',
          triggerOn: 'click',
          padding: 0,
          formatter (a, b) {
            const y = []
            for (let i = 0; i < 7; i++) {
              y.push(Number((Math.random() * 200).toFixed(0)))
            }
            const { data } = a
            const MyComponent = Vue.extend(popDemo1)
            const component = new MyComponent({
              propsData: {
                name: data.name,
                lineData: {
                  x: ['周一', '周二', '周三', '周四', '周五', '周六', '周日'],
                  y
                }
              }
            }).$mount()
            return component.$el.outerHTML
          }
        },
        geo: {
          type: 'map',
          map: 'zhejiang',
          show: false,
          roam: true,
          zoom: 1.2
        },
        series: [
          {
            type: 'map',
            map: 'zhejiang',
            roam: true,
            zoom: 1.2,
            label: {
              normal: {
                show: true,
                textStyle: {
                  color: '#fff',
                  fontSize: 12
                }
              },
              emphasis: {
                textStyle: {
                  color: 'pink',
                  fontSize: 20
                }
              }
            },
            itemStyle: {
              normal: {
                borderColor: '#2ab8ff',
                borderWidth: 1,
                areaColor: {
                  type: 'linear',
                  x: 0,
                  y: 1,
                  x2: 0,
                  y2: 0,
                  colorStops: [{
                    offset: 0,
                    color: '#001934'
                  },
                  {
                    offset: 1,
                    color: '#00377C'
                  }]
                },
                shadowColor: 'rgba(0, 0, 0, 0.5)',
                shadowBlur: 0,
                shadowOffsetX: 0,
                shadowOffsetY: 1
              },
              emphasis: {
                areaColor: '#206474',
                borderColor: '#00F8C9',
                borderWidth: 2
              }
            },
            data: cityData

          }
        ]

      }
      myChart.setOption(option, true)
      this.myChart = myChart
    }
echarts点标(这里引入了三种)
效果预览
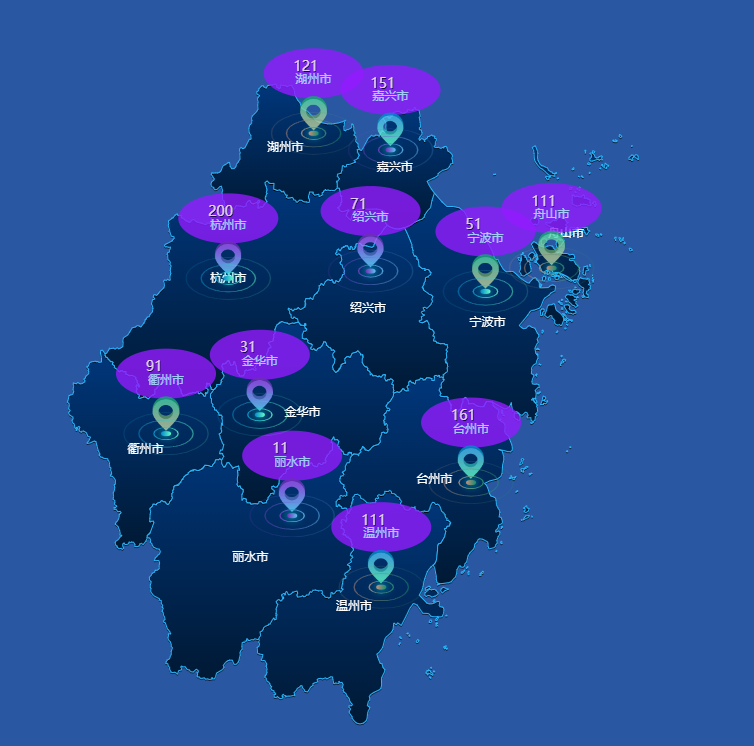
具体实现
注:本人并不建议用这种,因为不能放大、缩小、拖拽,这些操作会造成点位偏移。
- 核心代码如下
initMap (id) {
      const { cityData } = this
      const imgList = ['image://https://z3.ax1x.com/2021/07/19/WJUUiD.png', 'image://https://z3.ax1x.com/2021/07/19/WJdMuR.png', 'image://https://z3.ax1x.com/2021/07/19/WJdYCD.png']
      echarts.registerMap('zhejiang', zhejiang)
      const myChart = echarts.init(document.getElementById(id))
      const option = {
        tooltip: {
          trigger: 'item',
          triggerOn: 'click',
          padding: 0,
          formatter (a, b) {
            return ''
          }
        },
        geo: {
          type: 'map',
          map: 'zhejiang',
          show: false
        },
        series: [
          {
            type: 'map',
            map: 'zhejiang',
            label: {
              normal: {
                show: true,
                textStyle: {
                  color: '#fff',
                  fontSize: 12
                }
              },
              emphasis: {
                textStyle: {
                  color: 'pink',
                  fontSize: 20
                }
              }
            },
            itemStyle: {
              normal: {
                borderColor: '#2ab8ff',
                borderWidth: 1,
                areaColor: {
                  type: 'linear',
                  x: 0,
                  y: 1,
                  x2: 0,
                  y2: 0,
                  colorStops: [{
                    offset: 0,
                    color: '#001934'
                  },
                  {
                    offset: 1,
                    color: '#00377C'
                  }]
                },
                shadowColor: 'rgba(0, 0, 0, 0.5)',
                shadowBlur: 0,
                shadowOffsetX: 0,
                shadowOffsetY: 1
              },
              emphasis: {
                areaColor: '#206474',
                borderColor: '#00F8C9',
                borderWidth: 2
              }
            },
            data: cityData

          },
          // 水波纹
          {
            tooltip: {
              show: false
            },
            roam: true,
            type: 'effectScatter',
            coordinateSystem: 'geo',
            rippleEffect: {
              scale: 10,
              brushType: 'stroke'
            },
            showEffectOn: 'render',
            itemStyle: {
              normal: {
                shadowColor: '#0ff',
                shadowBlur: 10,
                shadowOffsetX: 0,
                shadowOffsetY: 0,
                color: function (params) {
                  const colorList = [
                    new echarts.graphic.LinearGradient(1, 0, 0, 0, [
                      {
                        offset: 0,
                        color: '#64fbc5'
                      },
                      {
                        offset: 1,
                        color: '#018ace'
                      }
                    ]),
                    new echarts.graphic.LinearGradient(1, 0, 0, 0, [
                      {
                        offset: 0,
                        color: '#168e6d'
                      },
                      {
                        offset: 1,
                        color: '#c78d7b'
                      }
                    ]),
                    new echarts.graphic.LinearGradient(1, 0, 0, 0, [
                      {
                        offset: 0,
                        color: '#61c0f1'
                      },
                      {
                        offset: 1,
                        color: '#6f2eb6'
                      }
                    ]),
                    new echarts.graphic.LinearGradient(1, 0, 0, 0, [
                      {
                        offset: 0,
                        color: '#168e6d'
                      },
                      {
                        offset: 1,
                        color: '#c78d7b'
                      }
                    ]),
                    new echarts.graphic.LinearGradient(1, 0, 0, 0, [
                      {
                        offset: 0,
                        color: '#61c0f1'
                      },
                      {
                        offset: 1,
                        color: '#6f2eb6'
                      }
                    ])
                  ]
                  return colorList[params.dataIndex % 6]
                }
              }
            },
            label: {
              normal: {
                color: '#fff'
              }
            },
            symbol: 'circle',
            symbolSize: [10, 5],
            data: cityData,
            zlevel: 1
          },
          // 点标
          {
            type: 'scatter',
            coordinateSystem: 'geo',
            itemStyle: {
              color: '#f00'
            },
            symbol: function (value, params) {
              console.log(params.dataIndex, imgList[params.dataIndex % 3])
              return imgList[params.dataIndex % 3]
            },
            symbolSize: [32, 41],
            symbolOffset: [0, -20],
            z: 9999,
            data: cityData
          },
          // 信息框
          {
            type: 'scatter',
            coordinateSystem: 'geo',
            label: {
              normal: {
                show: true,
                formatter: function (params) {
                  const name = params.name
                  const value = params.data.datas
                  const text = `{fline|${value}}\n{tline|${name}}`
                  return text
                },
                color: '#fff',
                rich: {
                  fline: {
                    padding: [0, 25],
                    color: '#fff',
                    textShadowColor: '#030615',
                    textShadowBlur: '0',
                    textShadowOffsetX: 1,
                    textShadowOffsetY: 1,
                    fontSize: 14,
                    fontWeight: 400,
                    textAlign: 'center'
                  },
                  tline: {
                    padding: [0, 27],
                    color: '#ABF8FF',
                    fontSize: 12,
                    textAlign: 'center'
                  }
                }
              },
              emphasis: {
                show: true
              }
            },
            itemStyle: {
              color: '#921AFF'
            },
            symbolSize: [100, 50],
            symbolOffset: [0, -60],
            z: 999,
            data: cityData
          }
        ]

      }
      myChart.setOption(option, true)
      this.myChart = myChart
    }

 浙公网安备 33010602011771号