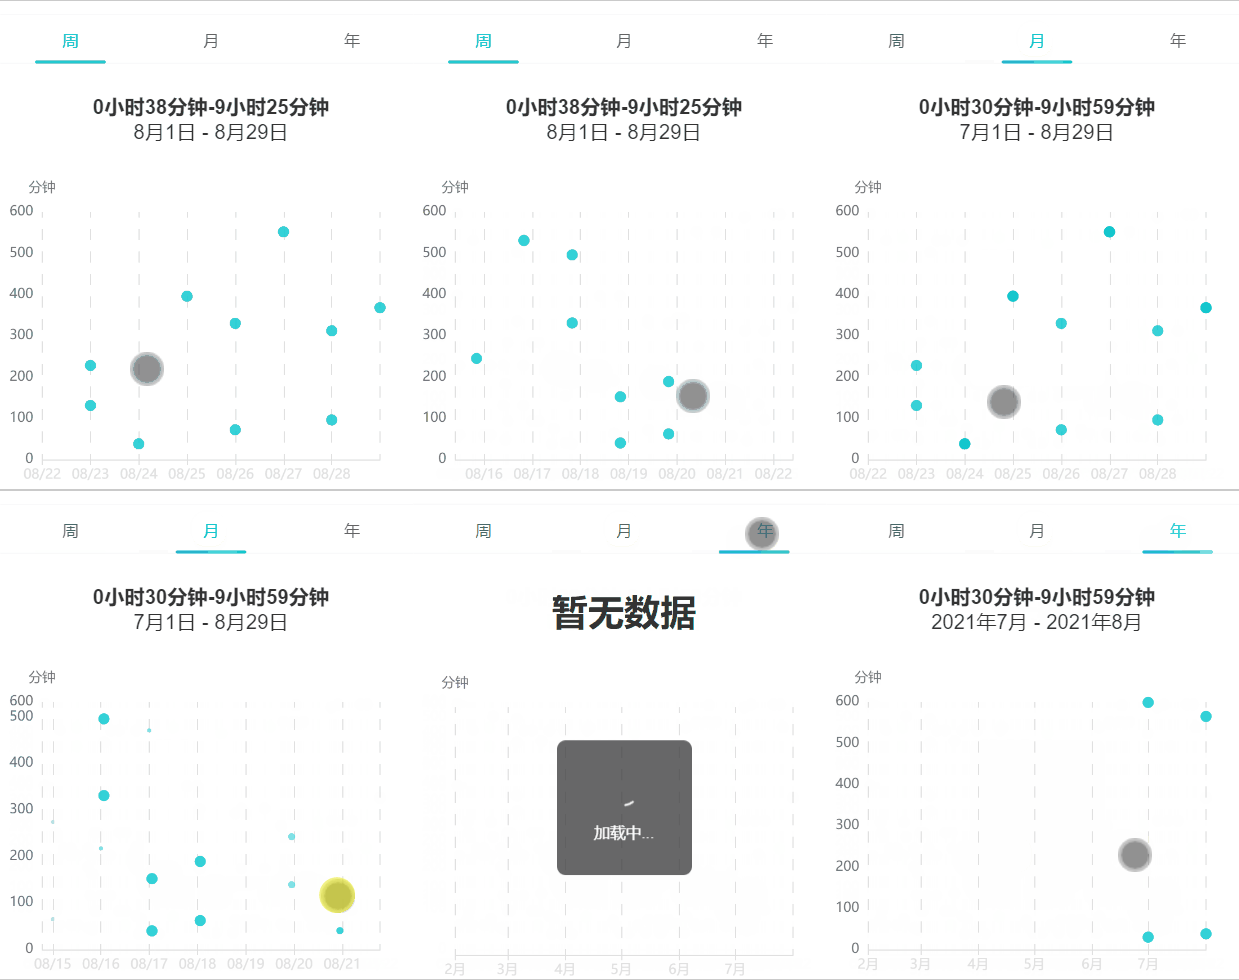
echarts图表按照时分,日,月,维度展示时间数据
echarts图表按照时分,日,月,维度展示时间数据
echarts 图表效果

问题记录
坐标轴类型设置为“time”之后,time图标默认坐标轴会进行缩放,显示精度会达到毫秒级别,但是需求时间只能精确到“日”,所以缩放时会出现大量空白时间段
echarts dataZoom配置
echarts 图表数据横向滚动并配置横坐标缩放刻度dataZoom配置如下
      const one_hour = 60 * 60 * 1000;
      const one_day = one_hour * 24;
      const range_start = {
        year: {
          start: 90,
          end: 100,
          minValueSpan: one_day * 30 * 7,
          maxValueSpan: one_day * 30 * 7,
        },
        month: {
          start: 90,
          end: 100,
          minValueSpan: one_day * 7,
          maxValueSpan: one_day * 7,
        },
        week: {
          start: 90,
          end: 100,
          minValueSpan: one_day * 7,
          maxValueSpan: one_day * 7,
        },
        day: {
          start: 90,
          end: 100,
          minValueSpan: one_hour * 7,
          maxValueSpan: one_hour * 7,
        },
      }
配置思想是,坐标轴上最大和最小间隔在每个维度下,都是各自相等的,如 "year"维度下都是7个月
echarts options配置
echarts options配置如下,其中dataZoom取值详见上面分别描述的“year”,“month”,“week”,“day”的取值。
      {
        color: ["#00C5CD", "#FF8510"],
        dataZoom: this.dataZoom,
        xAxis: {
          type: "time",
          min: "dataMin",
          max: "dataMax",
          boundaryGap: false,
          axisLabel: {
            // 格式化横轴坐标时间刻度
            formatter: {
              year: "{yyyy}年",
              month: "{M}月",
              day: "{MM}/{dd}",
              hour: "{HH}:{mm}",
              minute: "{HH}:{mm}",
              second: "{HH}:{mm}:{ss}",
              millisecond: "{hh}:{mm}:{ss} {SSS}",
              none: "{yyyy}-{MM}-{dd} {hh}:{mm}:{ss} {SSS}",
            },
          },
          // x轴显示竖线
          splitLine: {
            show: true,
            lineStyle: {
              // 显示虚线
              type: [10, 10],
              color: "#e0e0e0",
              dashOffset: 5,
            },
          },
          axisLine: {
            show: true,
            lineStyle: {
              color: "#e0e0e0",
            },
          },
        },
        yAxis: {
          type: "value",
          name: this.yUnit,
          splitLine: {
            show: false,
          },
          axisLine: {
            show: false,
          },
        },
        series: this.getSeries,
      }
打不死的小强


