matplotlib 在多条线中间填充颜色
用到的函数:
ax.fill_between
Ref:
[1] 文档链接:
函数介绍:https://matplotlib.org/stable/api/_as_gen/matplotlib.axes.Axes.fill_between.html#matplotlib.axes.Axes.fill_between
官方示例:https://matplotlib.org/stable/gallery/lines_bars_and_markers/fill_between_demo.html
[2] 一些示例:
https://stackoverflow.com/questions/4700614/how-to-put-the-legend-out-of-the-plot
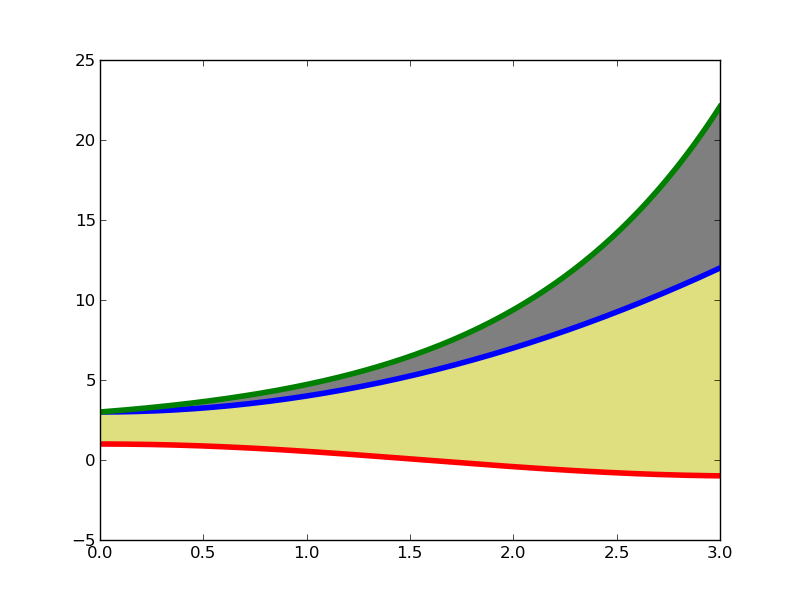
效果(来自ref[2]):
import pylab as plt
import numpy as np

X  = np.linspace(0,3,200)
Y1 = X**2 + 3
Y2 = np.exp(X) + 2
Y3 = np.cos(X)

plt.plot(X,Y1,lw=4)
plt.plot(X,Y2,lw=4)
plt.plot(X,Y3,lw=4)

plt.fill_between(X, Y1,Y2,color='k',alpha=.5)
plt.fill_between(X, Y1,Y3,color='y',alpha=.5)

plt.show()

 浙公网安备 33010602011771号