(转载)Matplotlib 面向对象编程简介
原文链接:
https://pages.alumik.cn/posts/44/
一些摘抄和补充
Matplotlib 中的对象主要有三种, FigureCanvas (画布), Figure (图像)和 Axes (坐标轴)。而 FigureCanvas 涉及到底层操作,暂时不必深究。
使用 Matplotlib 绘图需要搞清楚图像和坐标轴两个对象。只有真正理解这两个概念,才能获得对整个绘图过程的控制权。
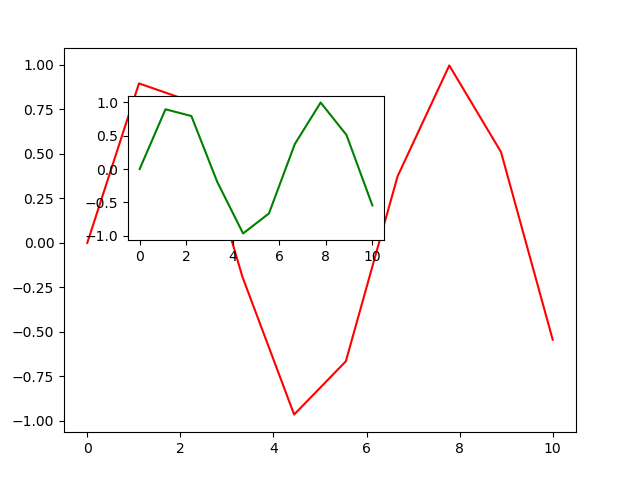
- 在一个子图中创建两个坐标轴 (e.g. “图中图”)
创建一个坐标轴,可以调用 Figure 实例的 add_axes 方法
import numpy as np
import matplotlib.pyplot  as plt

x = np.linspace(0, 10, 10)
y = np.sin(x)

fig = plt.figure()
ax1 = fig.add_axes([0.1, 0.1, 0.8, 0.8])  # 第一个坐标轴的范围
ax2 = fig.add_axes([0.2, 0.5, 0.4, 0.3])  # 第二个坐标轴的范围
ax1.plot(x, y, 'r')
ax2.plot(x, y, 'g')

fig.show()
这里我们创建了两个坐标轴 ax1 和 ax2 ,分别对两个坐标轴指定范围并作图。
效果:
- 创建两个子图
AxesSubplot 对象即子图。子图是自带坐标轴的。下列代码会在图像上创建两个子图(一行两列):
import numpy as np
import matplotlib.pyplot as plt

x = np.arange(1, 100, 1)

fig = plt.figure()

ax1 = fig.add_subplot(121)
ax1.plot(x, x, label='linear')
ax1.grid(color='g', linestyle='--')  # 设置网格
ax1.legend()                         # 设置图例

ax2 = fig.add_subplot(122)
ax2.plot(x, x ** 2, label='quadratic')

fig.show()
效果:

- 设置图像尺寸
在创建 Figure 对象的时候,我们可以使用 figsize 和 dpi 控制图像的尺寸。比如:
fig = plt.figure(figsize=(16,8), dpi=100)
figsize 表示图像长宽大小,单位为英寸。 dpi 表示每英寸的像素值。因此上面的命令创建了一张 1600*800 像素的图像。
- 保存图像
从上面输出的结果来看, plt.show 仅仅是将图像显示了出来。如果要保存图像,还需要通过 savefig 保存。没有显式指定图像和坐标轴,直接使用 plt.savefig 保存也可以,若显式指定了图像可以用 Figure 实例的 savefig 方法。 Matplotlib 可以将图像保存为多种格式的高质量图片,包括 PNG , JPG , EPS , SVG , PGF 和 PDF 等,只要写好后缀名即可。例如:
fig.savefig('result.png')
面向对象编程 和 使用matplotlib.pylot 区别 [均以x轴举例]
| 面向对象编程 | matplotlib.pyplot 接口 | 用途 |
|---|---|---|
| ax.set_title | plt.title | 标题 |
| ax.set_xlabel(xlabel, font2) | plt.xlabel | x轴标签 |
| ax.set_xlim | plt.xlim | Set the x-axis view limits. |
| ax.set_xscale('log') | plt.xscale(xscale) | Set the x-axis scale. value : |
| ax.tick_params(axis='both', which='major', labelsize=15) | plt.xticks(fontsize=15) | Change the appearance of ticks, tick labels, and gridlines. axis : {'x', 'y', 'both'}, optional |
官方文档:
