
局域网内PGIS地图的使用
局域网PGIS地图的使用:以天地图做打底,使用leaflet.js交互式地图 JavaScript 库做开发。
相关参考网址:https://leafletjs.cn/reference.html#map-example
区域回显:https://kklimczak.github.io/Leaflet.Pin/;
https://blog.csdn.net/BADAO_LIUMANG_QIZHI/article/details/124026478
热力图:https://www.jb51.net/javascript/290354ppf.htm
轨迹:https://blog.51cto.com/BADAOLIUMANGQZ/6843897
PS:相关搜索可搜Leaflet.MovingMarker-master
主要功能包括点的标记,区域的展示,以及点的点击事件;点的添加展示,区域的绘制,回显,编辑,删除;热力图;PGIS轨迹回放功能。相关代码如下:
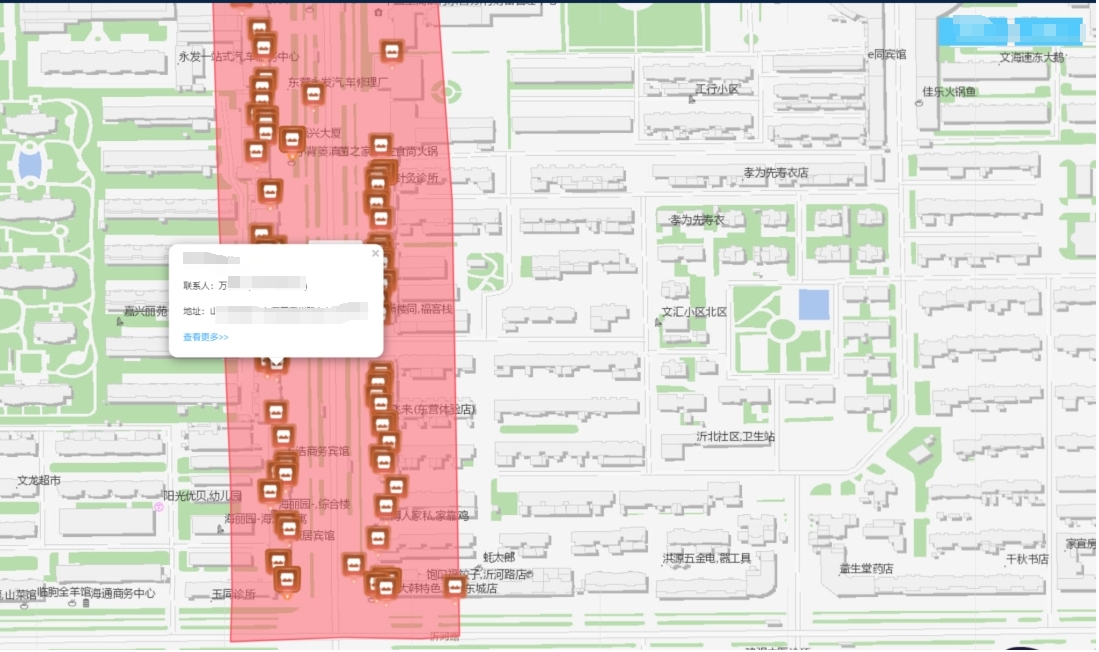
一、点的标记,区域的展示,以及点的点击事件
相关代码组件如下,此组件整合了热力图的展示,具体根据实际业务需要选择性展示:
<template>
<!-- 该组件是展示点的添加,区域的添加以及点击事件 和热力图的展示的整合组件 -->
<div class="data_map" style="height: 100%; position: relative">
<div
class="bg_heights"
style="position: relative; width: 100%"
:style="{ height: height }"
>
<div :id="mapId" style="width: 100%" :style="{ height: height }"></div>
</div>
<div class="tabClickA" v-if="$route.path != '/index'">
<div class="tabList" @click="clickGrid('1')">警务区</div>
<div class="tabList" @click="clickGrid('2')">网格</div>
</div>
</div>
</template>
<style scoped lang="scss"></style>
<style>
.anchorBL {
display: none;
}
body,
html,
#map {
height: 100%;
margin: auto;
font-family: "微软雅黑";
}
.my-label-a {
width: 100%;
height: 20px;
}
</style>
<script type="text/ecmascript-6">
// require('echarts/extension/bmap/bmap.min');
// import * as zrender from 'zrender' //引入zrender库
import 'leaflet.heat'
import { loadBMap } from './map'
var map;
var T = window.T;
export default {
props:{
height:{
type:String,
default:'100%'
},
mapId:{
type:String,
default:'mapId'
},
//商圈区域
businessList:{
type:Array,
default:()=>[]
},
//绘制商铺点
shopList:{
type:Array,
default:()=>[]
},
//绘制设备点
equList:{
type:Array,
default:()=>[]
},
//警务区网格
policeArea:{
type:Array,
default:()=>[]
},
//综治网格
gridArea:{
type:Array,
default:()=>[]
},
//警务区展示与否
isShowPolice:{
type:Boolean,
default:false
},
//网格展示与否
isShowGrid:{
type:Boolean,
default:false
},
//热力地图数据
houtData:{
type:Array,
default:()=>[
// {coor:[118.711996,37.440117], count: 45},
// {coor:[118.714751,37.439935], count: 56},
// {coor:[118.709006,37.442001], count: 127},
// {coor:[118.707861,37.438914], count: 89},
// {coor:[118.712757,37.434551], count: 13},
// {coor:[118.649018, 37.453269], count: 234},
// {coor:[118.718937,37.434179], count: 46},
// {coor:[118.718398,37.443677], count: 339},
// {coor:[118.713907,37.448061], count: 95},
// {coor:[118.713907,37.448061], count: 354},
]
},
//点击设备展示设备信息还是video
isShowVideo:{
type:Boolean,
default:false
},
//是否展示商圈边界
isBusiness:{
type:Boolean,
default:false
},
//这是商圈地图的点击商圈的展示与否的
isMapEvery: {
type: Boolean,
default:false
}
},
data(){
return {
mapLoading:false,
bgHeight:'668px',
map:'',
currentLat:118.70034983319356,
currentLon : 37.45030118084613,
getZoom:16, //地图当前的等级
previousBusinessPolygons: [], // 存储之前绘制的业务描边图形
previousPolicePolygons: [], // 存储之前绘制的警察描边图形
previousGridPolygons: [] // 存储之前绘制的网格描边图形
}
},
watch: {
businessList: {
handler: function (newObj, oldObj) {
let that = this;
that.addMarker(this.businessList,'business')
},
deep: true, // 深度监听
immediate: true // 会在监测开始时调用一次该处理函数
},
shopList: {
handler: function(newObj, oldObj) {
let that=this;
that.drawPoint(that.shopList,'shop')
},
deep: true, // 深度监听
// immediate: true // 会在监测开始时调用一次该处理函数
},
equList: {
handler: function(newObj, oldObj) {
let that=this;
that.drawPoint(that.equList,'camera')
},
deep: true, // 深度监听
immediate: true // 会在监测开始时调用一次该处理函数
},
policeArea: {
handler: function(newObj, oldObj) {
let that=this;
that.addMarker(that.policeArea,'police')
},
deep: true, // 深度监听
immediate: true // 会在监测开始时调用一次该处理函数
},
gridArea: {
handler: function(newObj, oldObj) {
let that=this;
that.addMarker(that.gridArea,'grid')
},
deep: true, // 深度监听
immediate: true // 会在监测开始时调用一次该处理函数
},
houtData: {
handler: function(newObj, oldObj) {
let that=this;
setTimeout(function(){
that.initHotMap()
},100)
},
deep: true, // 深度监听
immediate: true // 会在监测开始时调用一次该处理函数
},
},
methods:{
//初始化百度地图
initBdMap() {
var that = this
var cenPoint = [118.688,37.443]
var map = L.map(this.mapId, {
attributionControl:false,
crs:L.CRS.EPSG4326, //要使用的坐标系 WGS84 是目前最流行的地理坐标系统
center:[cenPoint[1],cenPoint[0]],
zoom: 16
});
//这里是加载的内网的瓦片地址
L.tileLayer('这是url', {
// L.tileLayer(imageURL, {
minZoom:0,
maxZoom:19,
zoomOffset:0,
tms:false
}).addTo(map);
this.map = map
},
//绘制点
drawPoint(data, type) {
var that = this
//获取所有的图层
let all = this.map._layers
let arr = Object.values(all)
arr.map(item=>{
if (item.class === "shopPointA") {
//如果是点图层就删除相关的点图层
that.map.removeLayer(item);
}
})
//图标大小
var LeafIcon = L.Icon.extend({
options: {
iconSize: [36, 47],
}
});
document.body.addEventListener('click', function(event) {
//查看更多的跳转
if (event.target.innerText == '查看更多>>') {
that.$router.push("/business/shopDetail?id="+event.target.id );
}
});
var data_info = data,content,newPoint,mapUrl,shopName;
for(var i = 0;i<data_info.length;i++){
//根据不同的类型展示不同的点的图片以及点击点的弹框的内容
if(type=='shop'){
mapUrl = require("../../assets/base/shop.png")
shopName = data_info[i].shopName
content = "<div class='skyDiv'>"+
"<div class='skyTitle'>"+shopName+"</div>"+
"<p class='skyP'>联系人:"+data_info[i].userName +' ('+data_info[i].phone+')'+"</p>"+
"<p class='skyP'>地址:"+data_info[i].addressName+"</p>"+
"<p class='skyP' style='color:#50b3ff;cursor: pointer' id='"+data_info[i].id+"'>查看更多>></p>"+
"</div>"
}else{
mapUrl = require("../../assets/base/equ.png")
shopName = data_info[i].name
content = "<div class='skyDiv'>"+
"<div class='skyTitle'>"+shopName+"</div>"+
"</div>"
}
//申明点
var icon = new LeafIcon({iconUrl: mapUrl});
L.icon = function (options) {
return new L.Icon(options);
};
newPoint = [data_info[i].longitude, data_info[i].latitude]
var shopPoint = L.marker([Number(newPoint[1]), Number(newPoint[0])], { icon: icon })
shopPoint.class='shopPointA' //确立点的标识,方便后期做相关的操作应用,具体看实际的业务逻辑
shopPoint.addTo(that.map).bindPopup(content); //bindPopup 在点上添加点击事件
}
},
//绘制区域描边
addMarker(data, type) {
let that = this
//添加警务网格
var business = data;
for(var i = 0;i<business.length;i++){
if(business[i].border!=''&&business[i].border!=null){
//整理绘制区域需要的数据格式
var policeGrid = business[i].border.split(';'),newArr = [],newArrNow = [],oneArr = []
if(policeGrid.length>0){
policeGrid.forEach(item=>{
var aa = [Number(item.split(',')[1]), Number(item.split(',')[0])]
newArr.push(aa)
})
//获取相关图层
let all = this.map._layers
let arr = Object.values(all)
var bus
//此处是商圈的区域添加 --》》mxj 20231214
if (type == 'business') {
bus = L.polygon(newArr, {
color: "#FF5663", weight: 2, opacity: 1, fillColor: "#FF5663", fillOpacity: 0.5,lineStyle:'dashed',
})
bus.class = 'businessA' //添加唯一标识
//isBusiness是在搜索的时候判断是否在次添加 --》》mxj 20231214
if (this.isBusiness == true) {
bus.bindTooltip(business[i].name, {
permanent: true,
direction: 'top'
}).openTooltip()
bus.addTo(that.map) //添加区域展示
} else {
if (that.isMapEvery == true) {
//此处的业务逻辑是先删除,在添加区域展示,具体的根据实际业务逻辑来
arr.map(item=>{
if (item.class === "businessA") {
//删除相关图层
that.map.removeLayer(item);
}
})
bus.bindTooltip(business[i].name, {
permanent: true,
direction: 'top'
}).openTooltip()
bus.addTo(that.map)
}
}
} else if (type == 'police') {
//此处是警务区的区域添加 --》》mxj 20231214
var police = L.polygon(newArr, {
color: "#FF5663", weight: 2, opacity: 1, fillColor: "#FF5663", fillOpacity: 0.5,lineStyle:'dashed',
})
police.class='policeA'
//isShowPolice判断是添加还是隐藏 --》》mxj 20231214
if(this.isShowPolice){
police.bindTooltip(business[i].policeDistrictName,{
permanent:true,
direction:'top'
}).openTooltip()
police.addTo(this.map) //添加
}else{
arr.map(item=>{
if (item.class === "policeA") { //删除
that.map.removeLayer(item);
}
})
}
}else if(type=='grid'){
//此处是网格的区域添加 --》》mxj 20231214
var grid = L.polygon(newArr, {
// color: "#FF642E", weight: 2, opacity: 1, fillColor: "#FF642E", fillOpacity: 0.5,lineStyle:'dashed',
color: "#FF5663", weight: 2, opacity: 1, fillColor: "#FF5663", fillOpacity: 0.5,lineStyle:'dashed',
})
grid.class='gridA'
//isShowGrid判断是添加还是隐藏 --》》mxj 20231214
if(this.isShowGrid){
grid.bindTooltip(business[i].gridName,{
permanent:true,
direction:'top'
}).openTooltip()
grid.addTo(this.map) //添加
}else{
arr.map(item=>{
if (item.class === "gridA") {
//删除
that.map.removeLayer(item);
}
})
}
}
}
}
}
},
clickGrid(data){
this.$emit('clickGrid',data)
},
//热力图
initHotMap(){
var that = this
//热力图添加之前先把之前的热力图层去掉,以防止多次重复添加
let all = this.map._layers
let arr = Object.values(all)
arr.map(item=>{
if (item.class === "heatA") {
that.map.removeLayer(item);
}
})
let heatDataList = [
// { lat: 39.6408, lng: 116.7728, count: 1 },
// { lat: 39.75, lng: 116.55, count: 1 },
// { lat: 39.55, lng: 116.55, count: 100 },
// { lat: 39.65, lng: 116.45, count: 1 },
// { lat: 39.45, lng: 116.35, count: 1 },
// { lat: 39.35, lng: 116.25, count: 1 },
// { lat: 39.25, lng: 116.15, count: 1 }
]
// 构造热力图数据
this.houtData.forEach((v) => {
// 纬度、经度、阈值
var aa = v.coor
let group = [aa[0], aa[1], v.count]
heatDataList.push(group)
})
// 生成热力图图层,并添加到地图中
let heat = L.heatLayer(heatDataList, {
radius: 12,
minOpacity: 0.2,
gradient: { // 自定义渐变颜色,区间为 0~1 之间(也可以不指定颜色,使用默认颜色)
'0.25': 'rgba(0, 0, 255, 1)',
'0.55': 'rgba(0, 255, 0, 1)',
'0.85': 'rgba(255, 255, 0, 1)',
'1': 'rgba(255, 0, 0, 1)'
}
});
heat.class='heatA'
heat.addTo(this.map)
},
},
//调用方法
mounted() {
var that = this
that.$nextTick(() => {
that.initBdMap();
})
}
}
</script>
<style lang="scss">
.tabClickA {
position: absolute;
top: 20px;
right: 20px;
display: flex;
z-index: 1000;
cursor: pointer;
.tabList {
width: 93px;
height: 38px;
background: #53c9fc;
color: #ffffff;
font-size: 14px;
text-align: center;
line-height: 38px;
margin-left: 10px;
}
}
.divOutMap {
width: 290px;
height: 185px;
background: url("http://218.56.180.213:8035/shopping/static/file/pic/202307/picrXBtW1uh1689581712300.png");
margin-top: -50px;
margin-left: -145px;
.topDiv {
display: flex;
padding: 25px 10px 0px 20px;
justify-content: space-between;
.closeDiv {
margin-left: 10px;
font-size: 14px;
color: #53c9fc;
text-decoration: underline;
}
opLeft {
font-size: 16px;
color: rgba(235, 251, 255, 0.8);
flex: 1;
overflow: hidden;
text-overflow: ellipsis;
white-space: nowrap;
}
.topRight {
font-size: 14px;
color: #53c9fc;
text-decoration: underline;
width: 56px;
}
}
.shopBoxMap {
padding: 0px 10px 0px 20px;
.shopOne {
background: rgba(58, 129, 200, 0.26);
border-radius: 5px;
height: 40px;
margin-top: 15px;
box-shadow: 0px 0px 15px rgba(50, 121, 198, 1) inset;
line-height: 40px;
color: #ffffff;
font-size: 14px;
padding: 0px 10px;
overflow: hidden;
text-overflow: ellipsis;
white-space: nowrap;
}
}
.mapShowImgA {
width: 250px;
height: 106px;
margin-top: 10px;
margin-left: 25px;
}
}
</style>
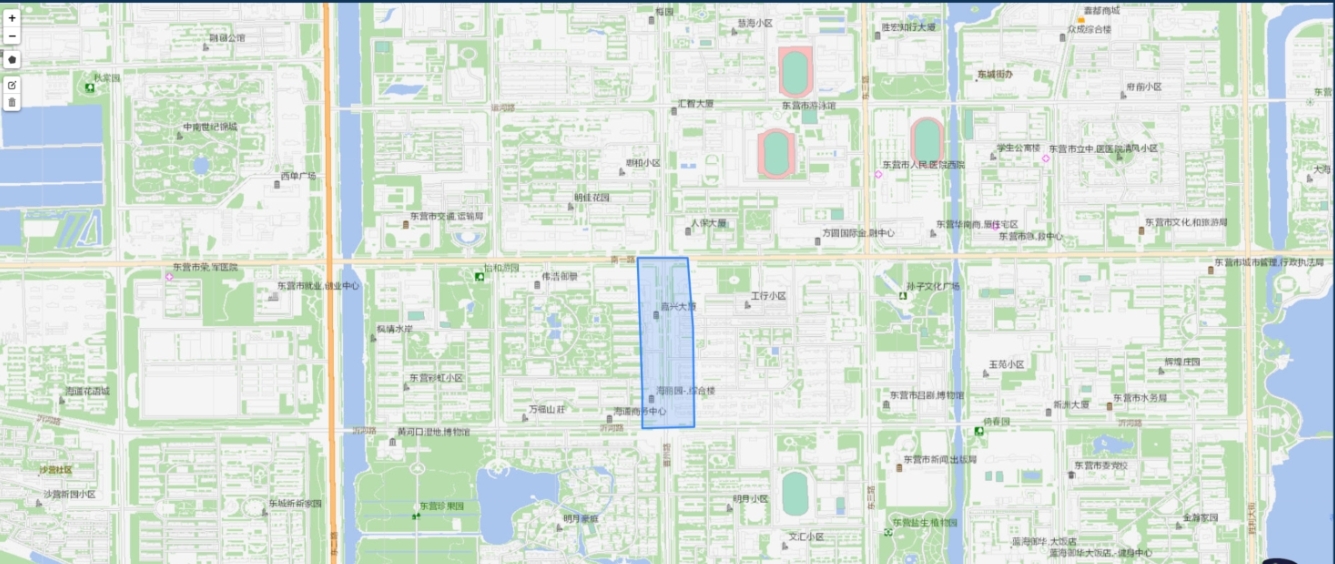
二、点的添加展示,区域的绘制,回显,编辑,删除功能
在public页面引入如下代码:
<!-- 局域网 -->
<link rel="stylesheet" href="leaflet.css"/>
<script type="text/javascript" src="leaflet.js"></script>
<script type="text/javascript" src="leaflet-hash.js"></script>
<script type="text/javascript" src="MovingMarker.js"></script>
<!-- 这是绘制区域 -->
<script type="text/javascript" src="Leaflet.draw.js"></script>
<link rel="stylesheet" href="leaflet.draw.css"/>
<script src="leaflet.pin.js"></script>
<!-- 天地图 -->
<script type="text/javascript" src="https://api.tianditu.gov.cn/api?v=4.0&tk=d98028206b9637c8e3e21a7041c01b7a"></script>
组件代码:
<!--
 * @Author: menxiaojin
 * @Date: 2023-07-14 10:24:08
 * @LastEditors: menxiaojin
 * @LastEditTime: 2023-08-24 13:36:24
-->
<template>
  <div class="appInner">
      <form-back></form-back>
      <base-cont height="100%" :isScrollbar="false">
          <template #head>
              <hy-header :importe="false" :exporte="false" :add="false" :deleted="false">绘制地图</hy-header>
          </template>
          <template #cont>
              <div >
                  <titleTwo title="基础信息"></titleTwo>
                  <disPlay>
                      <listOne paddingLeft="0px" name="商铺名称" :content="detailObj.name"></listOne>
                      <listOne name="是否绘制" :content="detailObj.border==''?'无':'是'"></listOne>
                      <listOne  paddingRight="0px" name="中心点坐标" :content="centerPoint.toString()"></listOne>
                      <div class="newDrawEwar">
                        <el-form >
                          <el-form-item label="拾取中心点坐标" class="labelItem" style="z-index: 30 !important;margin-bottom: 0 !important;padding-top:10px;padding-left:10px">
                            <el-switch v-model="getCenPoint" active-text="开始" inactive-text="关闭"></el-switch>
                          </el-form-item>
                        </el-form>
                      </div>
                  </disPlay>
              </div>
              <div id="adjustMap" class="adjustStyle" ></div>
          </template>
      </base-cont>
      <increasePop
        :centerDialogVisible.sync="tipsAlert"
        title="绘制数据"
        :ruleForm="ruleFormH"
        @resertClick="resertDetailH"
        @sureClick="sureClickH"
      >
        <form-textarea :value.sync="ruleFormH.areaStr" label="边界数据" preFixIcon="" placeholder="请输入边界数据"></form-textarea>
      </increasePop>
  </div>
</template>

<script>
import { businessEdit,businessDetail } from "@/api/shop/business";
import titleTwo from '@/components/shopNew/title.vue';
import listOne from '@/components/shopNew/list.vue';
import disPlay from '@/components/shopNew/disPlay.vue';
// import twoMap from "@/components/map/twoMap.vue";  //百度地图绘制
import twoMap from "@/components/map/twoMapNei.vue";  //天地图
import increasePop from '@/components/form/increasePop.vue';
export default {
  components: {titleTwo,listOne,disPlay,twoMap,increasePop},
  name: "Drawarea",
  data() {
      return {
        detailId:'',
        detailObj:{},
        map:null,
        centerPoint:[],
        getCenPoint:false,  //是否拾取中心点坐标
        //绘制完成的弹框
        tipsAlert:false,
        ruleFormH:{
          areaStr:'',
        },
        //地图
        nowArrBorder:[],
        newBorder:'',  //新绘制的边界数据
      }
  },
  mounted() {
      this.initDetail()
  },
  created(){
      this.detailId = this.$route.query.id;
  },
  methods: {
      resertDetailH(){
        this.tipsAlert = false
        this.ruleFormH.areaStr = ''
      },
      //获取详情
      initDetail(){
          let that=this;
          businessDetail({id:this.detailId}).then((res) => {
              if (res.code == 0) {
                  this.detailObj = res.data
                  if(res.data.border!=''&&res.data.border!=null){
                    var aa = res.data.border.split(';'),newArrBOrder = []
                    aa.forEach(item=>{
                      var singArr = [Number(item.split(',')[0]),Number(item.split(',')[1])]

                      newArrBOrder.push(singArr)
                    })
                    that.nowArrBorder = newArrBOrder
                    var bb = res.data.border.split(';')[0].split(',')
                    that.centerPoint = res.data.centerPoint.split(',');
                  }else{
                    that.centerPoint = [118.7241,37.45292]
                  }

                  that.$nextTick(() => {
                    that.initBdMap();
                  })
                  } else {
                  that.$global.tipMsg("error", res.msg);
              }
          });
      },
      cenPoint(data){
          this.centerPoint = data
          var that = this
          businessEdit({id:this.detailId,centerPoint:data.toString()}).then(res=>{
              if(res.code==0){
                  // this.$router.go(-1)
                  this.$global.tipMsg("success", '中心点设置成功');
              }else{
                  this.$global.tipMsg("error", res.msg);
              }
          }).catch()
      },
      //展示地图
      loadJson () {
        var data = this.nowArrBorder,newData = []
        data.forEach(item=>{
          var aa = JSON.stringify(item)
          newData.push(JSON.parse(aa))
        })
          return {
              "type": "FeatureCollection",
              "features": [{
                  "type": "Feature",
                  "properties": {},
                  "geometry": {
                      "type": "Polygon",
                      "coordinates": [
                        // [
                          // [118.69159877773762,37.481140660363366],
                          // [118.69102386221124,37.47756100936721],
                          // [118.70011471397221,37.47747509561818],
                          // [118.7004021717354,37.48016701241549],
                          // [118.69838996739306,37.48185656980892],
                          // [118.69159877773762,37.481140660363366]
                          // this.nowArrBorder
                          // [118.69159877773762, 37.481140660363366],
                          // [118.69102386221124, 37.47756100936721],
                          // [118.70011471397221, 37.47747509561818],
                          // [118.7004021717354, 37.48016701241549],
                          // [118.69838996739306, 37.48185656980892],
                          // [118.69159877773762, 37.481140660363366],
                          newData
                        // ]
                      ]
                  }
              },
            ]
          }
      },
      //添加点
      addPoint(data){
        var that = this
        var center = JSON.parse(data)   // 经度,维度的排序
        var LeafIcon = L.Icon.extend({
          options: {
              iconSize: [29, 25],
          }
        });
        let mapUrl = 'http://218.56.180.213:8035/shopping/static/file/pic/202307/piclCI6umdv1689299533795.png'
        var icon = new LeafIcon({iconUrl: mapUrl});
        L.icon = function (options) {
          return new L.Icon(options);
        };
        L.marker([center[1],center[0]],{icon: icon}).addTo(that.map);
      },
      //初始化百度地图
      initBdMap() {
           //声明地图
           var that = this
          var cenPoint = [Number(this.centerPoint[0]),Number(this.centerPoint[1])]
          var map = L.map('adjustMap', {
              attributionControl:false,
              crs:L.CRS.EPSG4326,  //要使用的坐标系  WGS84 是目前最流行的地理坐标系统
              center:[cenPoint[1],cenPoint[0]],
              zoom: 15,
          });
          // L.tileLayer('https://tile.openstreetmap.org/{z}/{x}/{y}.png', {
          // L.tileLayer('https://{s}.tile.openstreetmap.org/{z}/{x}/{y}.png', {
          L.tileLayer('这是url', {
          // L.tileLayer(imageURL, {
              minZoom:0,
              maxZoom:19,
              zoomOffset:0,
              tms:false
          }).addTo(map);
          this.map = map

          //添加绘制图层
          var drawnItems = new L.FeatureGroup();
          map.addLayer(drawnItems);
          //添加绘制控件
          var drawControl = new L.Control.Draw({
              draw:{
                  // //绘制线
                  polyline:false,
                  //绘制多边形
                  polygon:true,
                  //绘制矩形
                  rectangle:false,
                  //绘制圆
                  circle:false,
                  //绘制标注
                  marker:false,
                  //绘制圆形标注
                  circlemarker:false
              },
              edit:{
                  //绘制图层
                  featureGroup:drawnItems,
                  //图形编辑控件
                  edit:true,
                  //图形删除控件
                  remove:true,
              }
          });

      //添加绘制控件
      map.addControl(drawControl);
      //这里时将已绘制的区域进行回显展示
      if(this.nowArrBorder.length!=0){
        L.geoJson(this.loadJson(), {
          onEachFeature: function (feature, layer) {
            //设置颜色,目前没有到,暂时留存,不影响功能
            if(feature.geometry.type == "LineString") {
              layer.setStyle({
                color: 'purple',
                weight: 5
              });
            }
            drawnItems.addLayer(layer);
          }
        });

        map.addGuideLayer(drawnItems);
        map.removeGuideLayer(drawnItems);
      }
      //对中心点进行回显
      this.addPoint(JSON.stringify(this.centerPoint))

      // //绘制事件
      map.on(L.Draw.Event.CREATED, function(e){
         //获取绘制图形类型
         var type = e.layerType,
         //获取绘制图层
         drawlayer = e.layer;
         if (type === 'marker') {
             //显示Popup
             drawlayer.bindPopup('A popup!');
         }
         //显示图层
         drawnItems.addLayer(drawlayer);
         //几何信息字符串
         var latlngsStr = "";
          //获取多边形几何信息
         if (type == 'polygon') {
             if (drawlayer._latlngs[0].length > 0) {
                 for (var latlngslength = 0; latlngslength < drawlayer._latlngs[0].length; latlngslength++) {
                     //获取几何信息
                     latlngsStr +=  drawlayer._latlngs[0][latlngslength].lng + "," + drawlayer._latlngs[0][latlngslength].lat + ";"
                 }
                 var bb = [latlngsStr.slice(0,latlngsStr.length-1)];
                 that.newBorder = bb.toString();
                 that.ruleFormH.areaStr = bb.toString();
                 that.tipsAlert = true
             }
         }
         //显示信息
        });
        this.map.addLayer(drawnItems);
        // 删除事件
        this.map.on(L.Draw.Event.DELETED, this.handleDelete)
        // 编辑事件
        this.map.on(L.Draw.Event.EDITED, this.handleEdited)

        //监听鼠标点击事件,点击拾取坐标,设置中心店
        function onMapClick(e) {
          // console.log(e)
          if(that.getCenPoint == true){
            that.centerPoint = [e.latlng.lng,e.latlng.lat]
            //清空之前全部的标记点,然后重新添加
            $(".leaflet-marker-pane").empty()
            //点击的时候顺便加点
            that.addPoint(JSON.stringify(that.centerPoint))
            //设置中心点接口
            that.cenPoint(that.centerPoint)
          }
        };
        map.on('click',onMapClick);
      },
      //删除
      handleDelete(e){
        this.nowArrBorder = []
      },
      //编辑
      handleEdited(e){
        var that = this
        if(e.layers._layer!=undefined){
          var obj = e.layers._layers,newArr = [],arrSub=[],strSub = ''
          for(var i in obj) {
            newArr = obj[i]._latlngs[0]
          }
          for(var i = 0;i<newArr.length;i++){
            strSub+=newArr[i].lng+','+newArr[i].lat+';'   //strSu是上传所需要的数据
          }
          var bb = [strSub.slice(0,strSub.length-1)];
          businessEdit({id:this.detailId,border:bb.toString()}).then(res=>{
            if(res.code==0){
                this.$global.tipMsg("success", '保存成功');
            }else{
                this.$global.tipMsg("error", res.msg);
            }
          }).catch()
        }

      },
      //提交绘制
      sureClickH(){
        var that = this
        businessEdit({id:this.detailId,border:this.ruleFormH.areaStr}).then(res=>{
            if(res.code==0){
                this.tipsAlert = false
            }else{
                this.$global.tipMsg("error", res.msg);
            }
        }).catch()
      },
  },
};
</script>

<style  lang="scss">
.appInner {
  min-width: 1055px;
  height: 100%;
  position: relative;
}
.adjustStyle{
  width: 100%;
  height: calc(100% - 125px);
  margin-top: 20px;
}
.backBtnDraw{
  position: absolute;
  top:200px;
  right: 40px;
}
.showSearch{
  background: rgba(23, 114, 153, 1);
  padding: 10px;
  display: flex;
  border-radius: 5px;
}
.newDrawEwar{
  .el-form-item__label{
    width:100%;
    text-align: left;
    color: rgba(225, 225, 225, 0.5);
  }
  .el-form-item__content{
    // widows: 100%;
    background:rgba(75, 173, 248, 0.33);
    height: 32px;
    margin-top:35px;
    .el-radio{
      margin-left: 10px;
    }
    .el-switch{
      margin-left: 10px;
      margin-top: -10px;
      .el-switch__label{
        color: rgba(255,255,255,0.5);
      }
      .is-active{
        color: #47d0f1;
      }
    }
  }
}
</style>
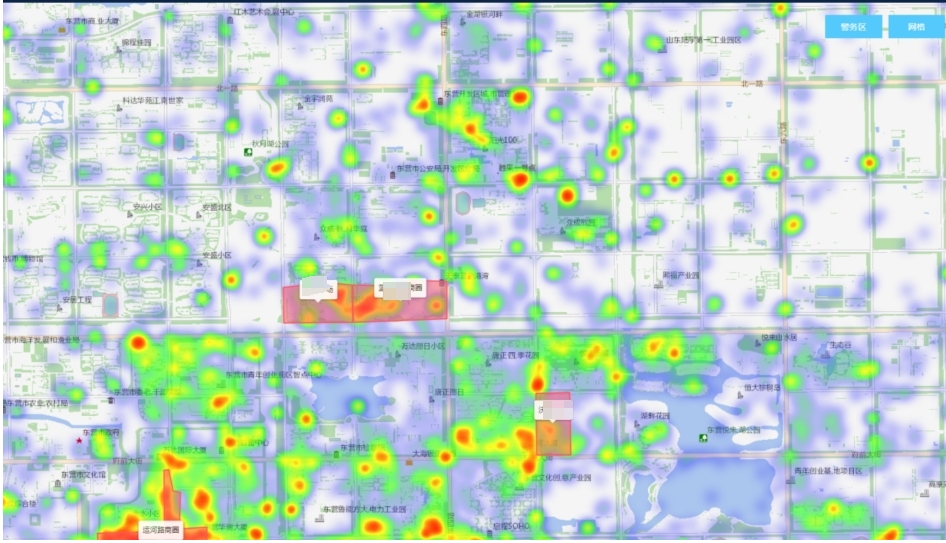
三、热力图的关键代码
在index.html页面引入js
<!-- 热力图 -->
    <script type="text/javascript" src="HeatmapOverlay.js"></script>
热力图相关主要代码:
//热力图
initHotMap(){
    var that = this
    //热力图添加之前先把之前的热力图层去掉,以防止多次重复添加
    let all = this.map._layers
    let arr = Object.values(all)
    arr.map(item=>{
        if (item.class === "heatA") {
            that.map.removeLayer(item);
        }
    })
    let heatDataList = [
        // { lat: 39.6408, lng: 116.7728, count: 1 },
        // { lat: 39.75, lng: 116.55, count: 1 },
        // { lat: 39.55, lng: 116.55, count: 100 },
        // { lat: 39.65, lng: 116.45, count: 1 },
        // { lat: 39.45, lng: 116.35, count: 1 },
        // { lat: 39.35, lng: 116.25, count: 1 },
        // { lat: 39.25, lng: 116.15, count: 1 }
    ]
    // 构造热力图数据
    this.houtData.forEach((v) => {
        // 纬度、经度、阈值
        var aa = v.coor
        let group = [aa[0], aa[1], v.count]
        heatDataList.push(group)
    })

    // 生成热力图图层,并添加到地图中
    let heat = L.heatLayer(heatDataList, {
        radius: 12,
        minOpacity: 0.2,
        gradient: { // 自定义渐变颜色,区间为 0~1 之间(也可以不指定颜色,使用默认颜色)
            '0.25': 'rgba(0, 0, 255, 1)',
            '0.55': 'rgba(0, 255, 0, 1)',
            '0.85': 'rgba(255, 255, 0, 1)',
            '1': 'rgba(255, 0, 0, 1)'
        }
    });
    heat.class='heatA'
    heat.addTo(this.map)
},
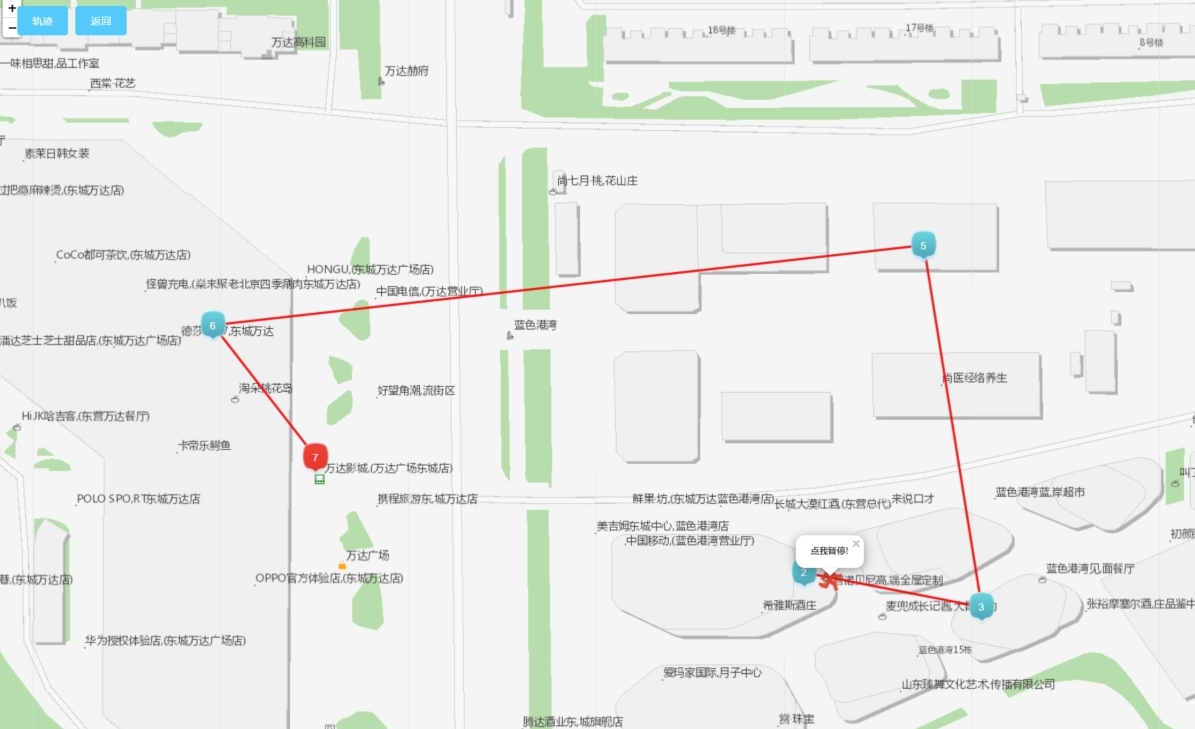
四、PGIS局域网地图的轨迹回放
主要代码:
<!--首页地图组件-->
<template>
    <!-- 该页面的逻辑是一开始展示轨迹,点击轨迹按钮出现播放轨迹动效的相关操作,点击返回重新返回轨迹静态展示页面 -->
  <div class="data_map" style="height: 100%">
    <div class="bg_heights" style="position: relative; height: 100%">
      <div :id="mapId" style="width: 100%; height: 100%"></div>
      <div class="bofang" v-if="markerArr.length != 0">
        <el-button
          type="primary"
          size="mine"
          @click="plackBack"
          v-if="condition"
          >轨迹</el-button
        >
        <el-button type="primary" size="mine" @click="continueMap"
          >返回</el-button
        >
      </div>
    </div>
  </div>
</template>
<style lang="scss">
.bofang {
  position: absolute;
  top: 20px;
  left: 30px;
  z-index: 1000;
}
</style>
<style lang="scss">
.anchorBL {
  display: none;
}
body,
html,
#map {
  height: 100%;
  margin: auto;
  font-family: "微软雅黑";
}
.divLabelMApText {
  width: 36px;
  height: 36px;
  text-align: center;
  line-height: 16px;
  font-size: 14px;
  color: #ffffff;
}
.divOutMapA {
  width: 320px;
  height: 185px;
  background: url("http://218.56.180.213:8035/shopping/static/file/pic/202307/picrXBtW1uh1689581712300.png")
    no-repeat;
  background-size: 100% 100%;
  margin-top: -50px;
  margin-left: -145px;
}
.pointClassNum {
  color: #ffffff;
  font-size: 14px;
  line-height: 12px;
  width: 12px;
  text-align: center;
}
.mapFlexDivGis {
  display: flex;
  .flexLeftImg {
    width: 80px;
    height: 90px;
  }
  .flexRight {
    flex: 1;
    padding-left: 10px;
    .flexRightListOne {
      width: 100%;
      line-height: 20px;
      color: #333333;
      font-size: 13px;
      padding: 3px 10px;
    }
    .flexRightListTwo {
      background: rgba(41, 147, 207, 0.4);
      line-height: 20px;
      color: #ffffff;
      font-size: 13px;
      padding: 5px 10px;
      margin-top: 15px;
    }
  }
}
</style>
<script type="text/ecmascript-6">
export default {
    props:{
        mapId:{
            type:String,
            default:'mapId'
        },
        zoom:{
            type:Number,
            default:17
        },
        markerArr:{
            type:Array,
            default:()=>[
                // {
                //     imgurl: "http://218.56.180.213:8137/policeNewFormalFile/subFace/snapFace/202211/20221128/snapFace1ec55445-4abf-4a8d-a59d-17ada05b02b3-0.png",
                //     visitTime: "2022-11-28 17:03:21",
                //     longitude: 118.712444,
                //     uptownName: "中国广饶今田小商品批发市场西门",
                //     latitude: 37.43991,
                //     cameraName: "花苑路交叉口朝东500m人脸",
                //     type:'start'
                // },
                // {
                //     imgurl: "http://218.56.180.213:8137/policeNewFormalFile/subFace/snapFace/202211/20221128/snapFace1ec55445-4abf-4a8d-a59d-17ada05b02b3-0.png",
                //     visitTime: "2022-11-28 17:03:21",
                //     longitude: 118.713192,
                //     uptownName: "中国广饶今田小商品批发市场西门",
                //     latitude: 37.441471,
                //     cameraName: "花苑路交叉口朝东500m人脸",
                //     type:''
                // },
                // {
                //     imgurl: "http://218.56.180.213:8137/policeNewFormalFile/subFace/snapFace/202211/20221128/snapFace1ec55445-4abf-4a8d-a59d-17ada05b02b3-0.png",
                //     visitTime: "2022-11-28 17:03:21",
                //     longitude: 118.710435,
                //     uptownName: "中国广饶今田小商品批发市场西门",
                //     latitude: 37.441478,
                //     cameraName: "花苑路交叉口朝东500m人脸",
                //     type:''
                // },
                // {
                //     imgurl: "http://218.56.180.213:8137/policeNewFormalFile/subFace/snapFace/202211/20221128/snapFace1ec55445-4abf-4a8d-a59d-17ada05b02b3-0.png",
                //     visitTime: "2022-11-28 17:03:21",
                //     longitude: 118.710929,
                //     uptownName: "中国广饶今田小商品批发市场西门",
                //     latitude: 37.439616,
                //     cameraName: "花苑路交叉口朝东500m人脸",
                //     type:''
                // },
                // {
                //     imgurl: "http://218.56.180.213:8137/policeNewFormalFile/subFace/snapFace/202211/20221128/snapFace1ec55445-4abf-4a8d-a59d-17ada05b02b3-0.png",
                //     visitTime: "2022-11-28 17:03:21",
                //     longitude: 118.709608,
                //     uptownName: "中国广饶今田小商品批发市场西门",
                //     latitude:37.4404,
                //     cameraName: "花苑路交叉口朝东500m人脸",
                //     type:'end'
                // },
            ]
        },
        //经纬度
        currentLat:{
            type:Number,
            default:0
        },
        currentLon:{
            type:Number,
            default:0
        }
    },
    data(){
        return {
            mapLoading:false,
            bgHeight:'668px',
            map:'',
            getZoom:15,   //地图当前的等级
            peopleLocus:'',
            trackAni:null,
            iconPeople:require('../../assets/base/flow_people.png'),
            condition:true,
            suspedContinueShow:true,
            playGis:null,
        }
    },
    //关键
    created(){
        let that=this;
        window.bigImg=that.bigImg;
    },
    watch: {
        currentLat: {
            handler: function (val) {
                let that=this;
                if(that.currentLat!=''&&that.map==''){
                    that.initAMap();
                }
                //设置地图中心点
                that.map.setView([this.currentLon,this.currentLat], 15)
            },
            // immediate: true
        },
        markerArr: {
            handler: function(newObj, oldObj) {
                let that=this;
                that.$nextTick(() => {
                    that.peopleMap()
                })
            },
            deep: true, // 深度监听
            immediate: true // 会在监测开始时调用一次该处理函数
        }
    },
    methods:{
        initAMap(){
            //声明地图
            var that = this
            var cenPoint = [this.currentLat,this.currentLon]
            var map = L.map(this.mapId, {
                attributionControl:false,
                crs:L.CRS.EPSG4326,  //要使用的坐标系  WGS84 是目前最流行的地理坐标系统
                center:[cenPoint[1],cenPoint[0]],
                zoom: 15
            });
            map.setView([cenPoint[1],cenPoint[0]], 15) //设置中心点以及zoom
            L.tileLayer('这是URL', {   //内网瓦片地址
                minZoom:0,
                maxZoom:19,
                zoomOffset:0,
                tms:false
            }).addTo(map);
            this.map = map
        },
        //清楚轨迹划线
        clearMap() {
            const that = this; // 保存Vue组件的上下文
            if (that.map) {
                that.map.eachLayer(function (layer) {
                    if (layer instanceof L.Marker || layer instanceof L.Polyline) {
                        that.map.removeLayer(layer);
                    }
                });
            }
        },
        peopleMap(id){
            var that = this
            this.clearMap();
            this.peopleLocus = this.map
            //图标大小
            var LeafIcon = L.Icon.extend({
                options: {
                    iconSize: [36, 47],
                }
            });
            var data_info = this.markerArr,content,newPoint,mapUrl,shopName,num;
            for(var i = 0;i<data_info.length;i++){
                if(data_info[i].type=='start'){
                    mapUrl=require('../../assets/base/start.png');
                }
                else if(data_info[i].type=='end'){
                    mapUrl=require('../../assets/base/end.png');
                }
                else{
                    mapUrl=require('../../assets/base/ing.png');
                }
                content = "<div class='mapFlexDivGis'>"+
                        "<img class='flexLeftImg' src='"+ that.$global.imgPross(data_info[i].photo) +"' width='100%'/>"+
                            "<div class='flexRight'>"+
                                "<p class='flexRightListOne'>时间:"+data_info[i].snapTime +"</p>"+
                                "<p class='flexRightListOne'>设备名称:"+data_info[i].deviceName+"</p>"+
                            "</div>"+
                        "</div>"
                var icon = new LeafIcon({iconUrl: mapUrl});
                L.icon = function (options) {
                    return new L.Icon(options);
                };
                newPoint = [data_info[i].longitude, data_info[i].latitude]
                num = i+1
                L.marker([newPoint[1],newPoint[0]],{icon: icon}).addTo(that.map)
                    .bindPopup(content);   //添加点以及点的点击事件

                // 写在初始化地图的方法里,必须放在mounted钩子中
                var customLabel = L.divIcon({
                    html: '<div class="my-label">'+num+'</div>',
                    className: 'pointClassNum'
                });
                // 添加自定义文本标注到地图上
                var labelMarker = L.marker([newPoint[1],newPoint[0]], {
                    icon: customLabel,
                    zIndexOffset: 0 // 防止标签与图标相互遮挡
                }).addTo(this.map);
            }
            //绘制线
            var points = new Array();
            for (var i = 0; i < data_info.length; i++) {
                var p0 = data_info[i].longitude;
                var p1 = data_info[i].latitude;
                var newPoint = [p0, p1]
                var thePoint1 = [newPoint[1],newPoint[0]]
                points.push(thePoint1);
            }
            var polyline = L.polyline(points, {
                color: 'RGBA(255, 0, 0, 0.7)',//线的颜色
                weight: 3 //线的粗细
            }).addTo(this.map);
      },

        // 回放按钮
        plackBack(){
            let that=this;
            that.suspedContinueShow = true;
            that.backShow = true;
            let mapData=that.markerArr,newArr = [];
            var newArrTime = []
            for(var i = 0;i<mapData.length;i++){
                var newPoint = [mapData[i].longitude, mapData[i].latitude]
                let item = [newPoint[1],newPoint[0]]
                newArr.push(item)
                newArrTime.push(5000)
            }
            that.map.fitBounds(newArr);


            var LeafIcon = L.Icon.extend({
                options: {
                    iconSize: [31, 36],
                }
            });
            var mapUrl = this.iconPeople

            var icon = new LeafIcon({iconUrl: mapUrl});
            L.icon = function (options) {
                return new L.Icon(options);
            };

            var marker1 = L.Marker.movingMarker(newArr, newArrTime,{icon: icon}).addTo(that.map);

            L.polyline(newArr,{color:'RGBA(255, 0, 0, 0.7)'}).addTo(that.map);
            marker1.once('click', function () {
                marker1.start();
                marker1.closePopup();
                marker1.unbindPopup();
                marker1.on('click', function() {
                    if (marker1.isRunning()) {
                        marker1.pause();
                    } else {
                        marker1.start();
                    }
                });
                setTimeout(function() {
                    marker1.bindPopup('<b>点我暂停!</b>').openPopup();
                }, 1000);
            });

            marker1.bindPopup('<b>点我播放 !</b>', {closeOnClick: true});
            marker1.openPopup();
            that.playGis = marker1

        },
        //返回  清空播放轨迹的图层
        continueMap(){
            this.suspedContinueShow = !this.suspedContinueShow
            this.map.removeLayer(this.playGis)
        },
    },
    //调用方法
    mounted() {

    }
}
</script>

 浙公网安备 33010602011771号