自定义的Qt给统计图添加颜色样例控件
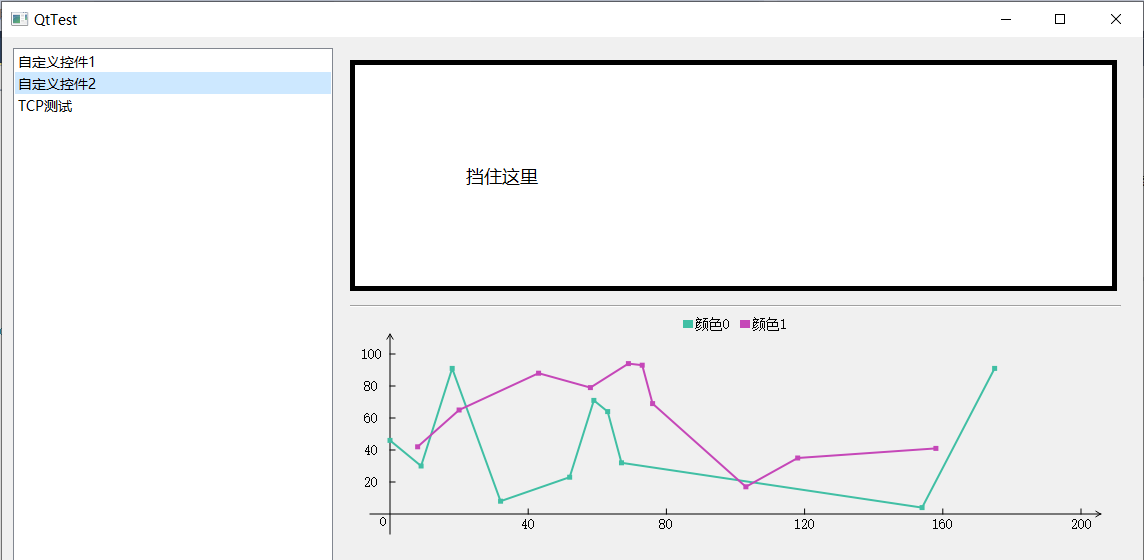
本文主要是给博文“自定义的Qt折线图控件”的图表添加颜色样例。之所以分开叙述是因为本文也是自定义控件,它不仅可以给折线图添加,还可以给其他类型的图表(柱状图、饼形图等,如果后续有这类文章的话)添加。本文代码在VS2015和Qt5.9上测试通过。此类较简单,用法是new MColorComment实例,并或然后将MPolyline设为它的父亲,再调用它的add函数向其中添加颜色和对应的文本注释就行了。默认的,该控件显示在MPolyline的上方居中位置。下面是效果图:
上代码,头文件:
class MColorComment : public QWidget
{
    Q_OBJECT

public:
    MColorComment(QWidget* parent = nullptr);
    void setParent(QWidget *parent); /* 隐藏父类方法 */
    void add(QRgb rgb, const QString& text);

private:
    void paintEvent(QPaintEvent *event) override;
    bool eventFilter(QObject *watched, QEvent *event) override;

private:
    QMultiMap<QRgb, QString> comments;
};
CPP文件:
MColorComment::MColorComment(QWidget* parent) :
    QWidget(parent)
{
    if (parent)
    {
        parent->installEventFilter(this);
    }
}

void MColorComment::setParent(QWidget *parent)
{
    QObject* old = this->parent();
    if (old)
    {
        removeEventFilter(old);
    }
    QWidget::setParent(parent);
    if (parent)
    {
        parent->installEventFilter(this);
    }
}

void MColorComment::add(QRgb rgb, const QString& text)
{
    comments.insert(rgb, text);
    update();
}

void MColorComment::paintEvent(QPaintEvent *event)
{
    const int pad1 = 2; /* 色块和文字之间间距 */
    const int pad2 = 10; /* 文字后的留白 */
    const QSize colorBlock(10, 8);
    QPainter painter(this);
    QFontMetrics fm = painter.fontMetrics();
    int sum = 0;
    for (const auto& str : comments.values())
    {
        QSize strsz = fm.size(0, str);
        sum += colorBlock.width();
        sum += pad1;
        sum += strsz.width();
        sum += pad2;
    }
    sum -= pad2; /* 结尾多加的 */

    int xpos = (width() - sum) / 2;
    for (auto it = comments.begin(); it != comments.end(); it++)
    {
        QRect temp;
        temp.setX(xpos);
        temp.setY((height() - colorBlock.height()) / 2);
        temp.setSize(colorBlock);
        painter.fillRect(temp, QColor(it.key()));
        xpos += colorBlock.width();
        xpos += pad1;
        QSize itsz = fm.size(0, it.value());
        temp.setX(xpos);
        temp.setY((height() - itsz.height()) / 2);
        temp.setSize(itsz);
        painter.drawText(temp, it.value());
        xpos += itsz.width();
        xpos += pad2;
    }
}

bool MColorComment::eventFilter(QObject *watched, QEvent *event)
{
    QWidget* p = dynamic_cast<QWidget*>(watched);
    if (event->type() == QEvent::Resize)
    {
        setFixedSize(p->width(), 20);
    }
    return false;
}
下面给出主窗口构造函数中设置折线图和它的颜色样例的例子。代码中ui.poLines是折线图(MPolyline*):
QtTest::QtTest(QWidget *parent)
    : QMainWindow(parent)
{
    ui.setupUi(this);

    ...

    qsrand((int)time(0));
    MColorComment* comment = new MColorComment();
    comment->setParent(ui.poLines);
    for (int i = 0; i < 2; i++)
    {
        QVector<QPointF> pts;
        for (int j = 0; j < 10; j++)
        {
            pts.push_back(QPointF(qrand() % 200 - 10, qrand() % 100));
        }
        std::sort(pts.begin(), pts.end(), [](QPointF a, QPointF b) { return a.x() < b.x(); });
        std::for_each(pts.begin(), pts.end(), [](QPointF& x) { return x *= 1; });
        QRgb color = ui.poLines->append(pts);
        comment->add(color, QString(u8"颜色%1").arg(i));
    }

    ...

}