
VSCode 远程编辑与调试STM32
环境准备
- 主机环境: Windows 10
- 远程编译环境: Ubuntu 20.04 LTS
- 开发板MCU: STM32F429
1. 主机安装SSH软件
Windows 10可以选择安装OpenSSH(安装特别慢,放弃),或者通过安装Git来安装SSH。

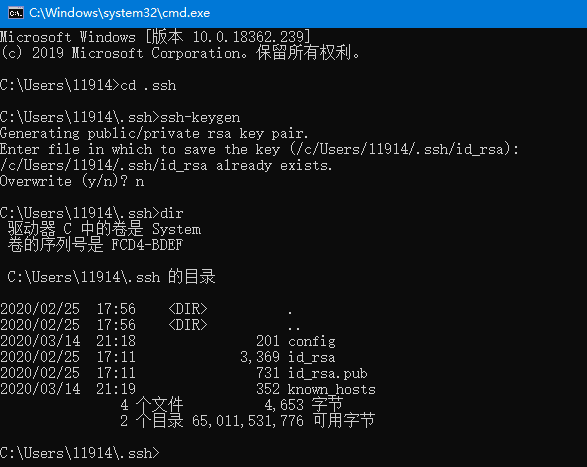
2. 配置密钥
在.ssh目录下用ssh-keygen命令生成密钥对,之后会在当前目录下生成id_rsa.pub及id_rsa文件,
如图,我已经生成过了所以选择n不覆盖,初次运行选择y之后一路回车即可.之后将生成的公钥id_rsa.pub
内的内容添加进远程编译环境的个人目录下的.ssh文件夹下的authorized_keys文件内即可(没有就新建).
3. Remote SSH配置
- 点击左边栏Remote Explorer(画蓝框的小电脑)
- 点击SSH TARGETS 内的Configure(画蓝框的小齿轮)
- 选择配置文件,一般选择个人目录下的配置文件(画蓝线部分)

- 编辑配置文件config
# Read more about SSH config files: https://linux.die.net/man/5/ssh_config Host server HostName 192.168.56.111 User mt PreferredAuthentications publickey IdentityFile ~/.ssh/id_rsa
- Host: 连接的主机的名称
- Hostname: 远程主机的IP地址
- User: 用于登录远程主机的用户名
- Port: 用于登录远程主机的端口,未修改使用默认22端口的可不配置
- PreferredAuthentications: 首选认证方式,填写公钥认证
- IdentityFile: 本地的id_rsa(私钥)的路径
- 连接远程主机
配置文件编辑保存后,右键配置好的主机,点击连接.

连接完成后终端输出远程主机信息,左下角显示连接的远程主机名.

之后安装一些喜欢的扩展到远程主机上,就可以在本地编辑远程主机上的程序了.
程序编译下载配置
1.安装编译工具(远程主机操作)
- 编译工具: gcc-arm-none-eabi 直接sudo apt install 安装即可
- 片上调试器: openOCD 直接sudo apt install 安装即可
2. VSCode添加任务
点击Terminal 选择Configure Tasks... 编辑 task.json 文件

添加openocd,make,telnet localhost 4444任务
{ // See https://go.microsoft.com/fwlink/?LinkId=733558 // for the documentation about the tasks.json format "version": "2.0.0", "tasks": [ { "label": "openocd", "type": "shell", "command": "sudo openocd -f /usr/share/openocd/scripts/interface/cmsis-dap.cfg -f /usr/share/openocd/scripts/target/stm32f4x.cfg && exit" }, { "label": "make", "type": "shell", "command": "cd build && make -j4 && exit", "problemMatcher": [] }, { "label": "telnet localhost 4444", "type": "shell", "command": "telnet localhost 4444 && exit", "problemMatcher": [] } ] }
- openocd: 打开openocd连接目标开发板,指定调试器(cmsis-dap,也支持J-Link等其他调试器),指定目标板(stm32f4x.cfg 其他mcu在文件夹下自行查找)
- make: 编译程序,根据个人习惯指定编译方式(个人使用make工具指定makefile文件编译)
- telnet localhost 4444: 打开openocd开启的gdb端口以下载调试程序
3. 执行任务
- 在VSCode界面下,按F1键输入Tasks: Run Task 回车

- 选择一个任务,点击

- 选择Continue without scanning the task output

- 执行结果如下
- make: 略
- openocd: 输入sudo密码后,显示CMSIS-DAP连接信息

- telnet localhost 4444:
- halt: 停止芯片
- flash write_image erase file.bin 0x8000000: 下载程序file.bin到目标板0x8000000地址
- reset: 复位芯片

调试程序
1. 调试配置
点击Run 选择Open Configurations(没有就选择Add...)编辑launch.json文件

{ // Use IntelliSense to learn about possible attributes. // Hover to view descriptions of existing attributes. // For more information, visit: https://go.microsoft.com/fwlink/?linkid=830387 "version": "0.2.0", "configurations": [ { "name": "(gdb) Launch", "type": "cppdbg", "request": "launch", "program": "stm32", "targetArchitecture": "arm", "args": [], "stopAtEntry": true, "cwd": "${workspaceFolder}", "environment": [], "externalConsole": false, "MIMode": "gdb", "miDebuggerPath": "/usr/bin/gdb-multiarch", "setupCommands": [ { "description": "Enable pretty-printing for gdb", "text": "-enable-pretty-printing", "ignoreFailures": true } ] "launchCompleteCommand": "None", "miDebuggerServerAddress": "localhost:3333", "customLaunchSetupCommands": [ { "text": "file /home/mt/RT-Template/build/rt-thread.elf", "description": "load file to gdb", "ignoreFailures": false }, { "text": "target remote :3333", "description": "connect to server", "ignoreFailures": false }, { "text": "load", "description": "download file to MCU", "ignoreFailures": false }, { "text": "monitor reset", "description": "reset MCU", "ignoreFailures": false }, { "text": "b main", "description": "set breakpoints at main", "ignoreFailures": false }, ] } ] }
- miDebuggerPath: Ubuntu 18.04 LTS apt install安装的gcc-arm-none-eabi工具链没有arm-none-eabi-gdb工具 所以选择apt install安装gdb-multiarch调试工具,并把工具路径添加到miDebuggerPath后
- miDebuggerServerAddress: localhost:3333 openocd开启的debug调试端口
- customLaunchSetupCommands:指令
- file file.elf: 加载编译生成的elf加载到gdb服务器
- target remote :3333: 连接到openocd开启的gdb服务器
- load: 下载编程后的程序到MCU
- monitor reset: reset MCU
- b main: main函数处打断点,保证至少有一个断点,需要在main函数执行前打断点(比如RTOS在main前进行一些系统初始化)可以在VSCode界面内手动添加断点
2. 开始调试
点击Run 选择Start Debugging 或 按F5

之后进入如下界面

程序自动停止在main函数入口处(不在main之前添加其他断点的前提下),可以鼠标点击行号左侧添加/删除断点,
可以在左侧窗口查看变量值(VARIABLES),添加变量值监控(WATCH),查看断点(BREAKPOINTS),查看调用栈(CALL STACK),
可以在右侧点击执行全速执行,下一步,进入函数,跳出函数,复位,停止的操作
小结
1. VSCode宇宙第一
2. Window 10现在可能自带OpenSSH客户端不需要自行安装,由于配置VSCode前已安装Git客户端,就没有在意这个问题
参考资料: https://zhuanlan.zhihu.com/p/68577071
参考资料: https://www.rt-thread.org/qa/thread-421278-1-1.html


【推荐】国内首个AI IDE,深度理解中文开发场景,立即下载体验Trae
【推荐】编程新体验,更懂你的AI,立即体验豆包MarsCode编程助手
【推荐】抖音旗下AI助手豆包,你的智能百科全书,全免费不限次数
【推荐】轻量又高性能的 SSH 工具 IShell:AI 加持,快人一步
· 分享一个免费、快速、无限量使用的满血 DeepSeek R1 模型,支持深度思考和联网搜索!
· 使用C#创建一个MCP客户端
· 基于 Docker 搭建 FRP 内网穿透开源项目(很简单哒)
· ollama系列1:轻松3步本地部署deepseek,普通电脑可用
· 按钮权限的设计及实现