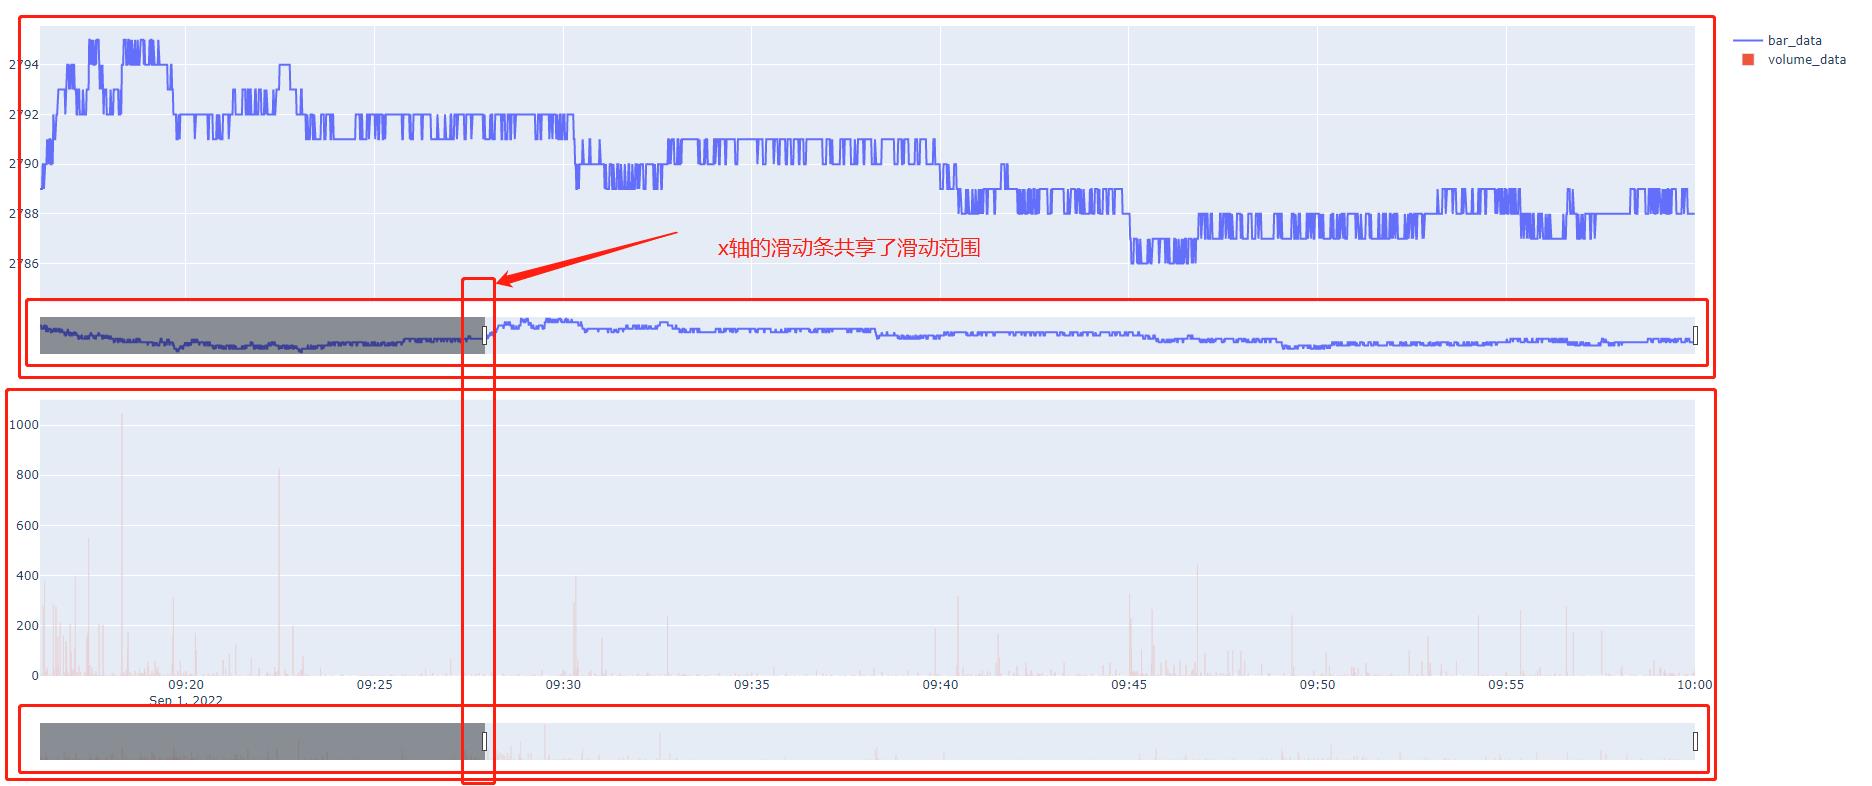
python plotly 将x轴滑块(rangeslider)作用于不同子图
因为数据量太大,需要用x轴滑块选择范围看数据
同时,范围内的数据维度太多,导致图形比较乱
需要将trace绘制到不同的子图中
产生了将x轴的滑块滑动范围同步的需求
实现方法是共享x轴
import plotly as py
from plotly import graph_objects as go
from plotly.subplots import make_subplots

fig = make_subplots(rows=2,cols=1,
                    shared_xaxes=True  # 这一步是关键
                    )

price_trace = go.Scatter(x=data['datetime'],
                        y=data['close_price'],
                        mode='lines',name='bar_data')

fig.add_trace(price_trace,row=1,col=1)
volume_trace = go.Bar(x=data['datetime'],
                      y=data['volume'],
                      name = 'volume_data')

fig.add_trace(volume_trace,row=2,col=1)
fig.update_xaxes(rangeslider_visible=True)
# fig.layout.xaxis.rangeslider.visible = False  # 设置滑块是否可见,滑块不可见也能共享范围,但是无法预览全轴

# 指定滑块厚度
fig.layout.xaxis.rangeslider.thickness=0.05
fig.layout.xaxis2.rangeslider.thickness=0.05

py.offline.plot(fig, filename=f'result/aaa.html', auto_open=False)
效果如下:

出处: https://www.cnblogs.com/meizhengchao/p/16862364.html
本文版权归作者和博客园共有,欢迎转载,但未经作者同意必须保留此段声明,且在文章页面明显位置给出, 原文链接 如有问题, 可邮件(meizhengchao@qq.com)咨询.


