
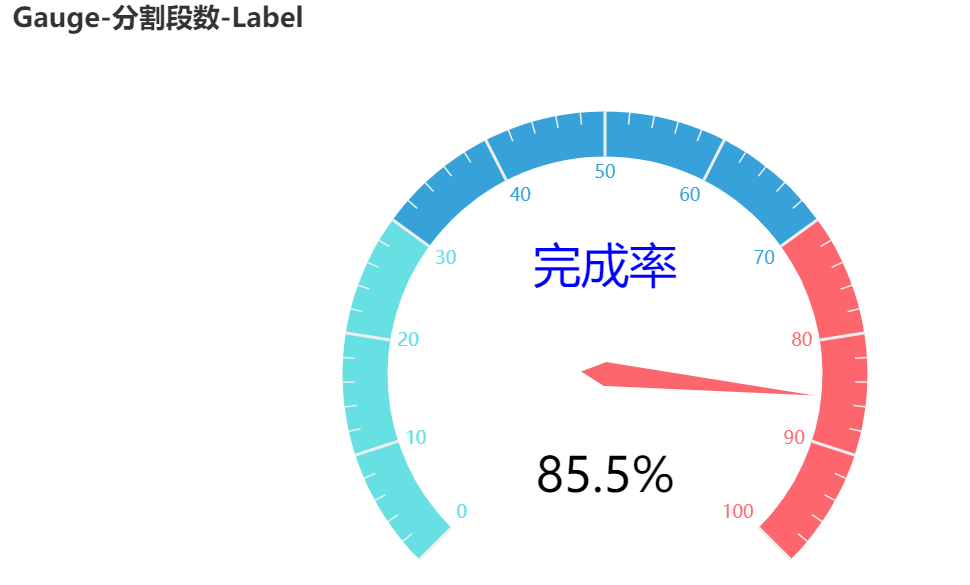
python生成仪表盘
前提:已安装Pyecharts
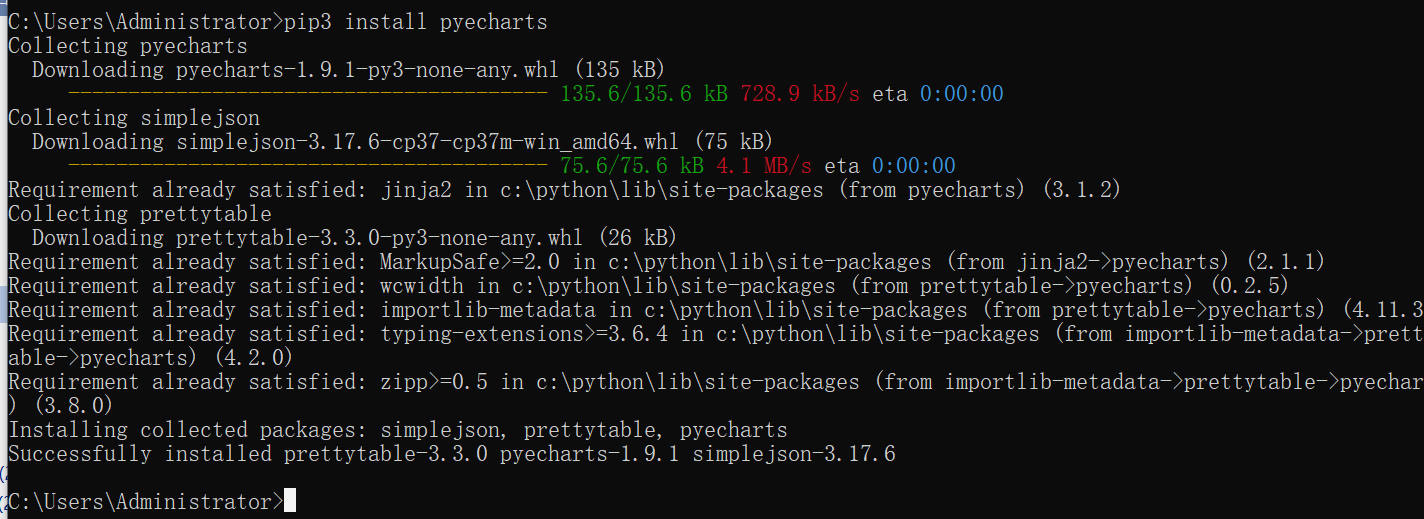
安装pyecharts(本实例安装后是1.9.1版本)
pip3 install pyecharts
from pyecharts import options as opts
from pyecharts.charts import Gauge
#指示针的颜色与数值所属区间的颜色一致
c = (
    #设置展示的图形大小800*500 。 gauge = Gauge()  #使用默认大小形式
    Gauge(init_opts=opts.InitOpts(width="800px", height="500px"))
    .add(
        "业务指标",
        [("完成率", 85.5)],
        # 设置比例大小
        radius="70%",
        # 设置起始、终止刻度
        min_=0,max_= 100,
        #分割成为5段
        split_number=10,
        axisline_opts=opts.AxisLineOpts(
            linestyle_opts=opts.LineStyleOpts(
                # 设置区间颜色、仪表宽度
                color=[(0.3, "#67e0e3"), (0.7, "#37a2da"), (1, "#fd666d")], width=30
            )
        ),
        #文字部分的字体颜色及大小设置.“完成率”3个字的设置
        title_label_opts=opts.LabelOpts(
            font_size=32, color="blue", font_family="Microsoft YaHei"
        ),
        #标注的数字字体及格式。本实例 85.5字体大小及颜色的设置
        detail_label_opts=opts.LabelOpts(
            #数值标签的格式设定
            formatter="{value}%",font_size=32, color="black", font_family="Microsoft YaHei"),

    )
    .set_global_opts(
        title_opts=opts.TitleOpts(title="Gauge-分割段数-Label"), # 设置标题
        legend_opts=opts.LegendOpts(is_show=False),
    )
    #生成网页形式
    #.render("gauge_splitnum_label.html")
)
c.render_notebook()#在notebook直接生成图形
运行完成结果如下:
来源:https://zhuanlan.zhihu.com/p/477173040

 浙公网安备 33010602011771号