
基于BP神经网络的城市空气质量数据预测matlab仿真
1.算法运行效果图预览
2.算法运行软件版本
matlab2022A
3.算法理论概述
3.1 BP神经网络结构
一个典型的BP(Backpropagation)神经网络包含输入层、隐藏层和输出层。假设我们有一个三层的BP神经网络,其结构如下:
输入层:有n个节点,代表n种影响空气质量的因素(如PM2.5、SO2、NO2等)。
隐藏层:有m个节点,每个节点表示一种潜在的非线性组合特征。
输出层:有k个节点,对应k种空气质量指标预测值(如AQI指数)。
4.2 神经元模型与激活函数
对于第L层的第i个神经元,其输入信号为:
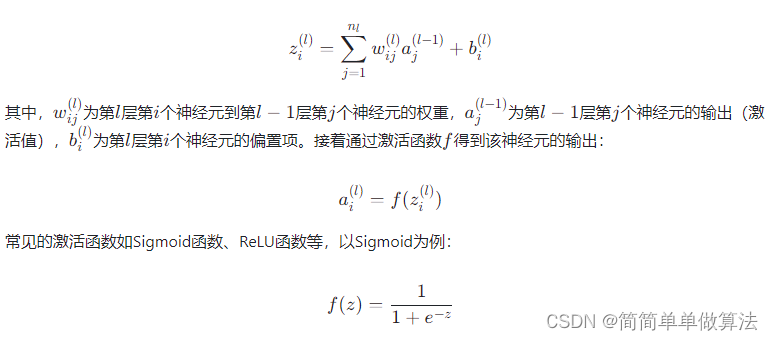
3.3 前向传播过程
输入层至输出层的数据流动称为前向传播,对于空气质量预测问题,输入是历史空气质量数据和气象参数,经过多次非线性变换后,输出层得到预测的空气质量指数。
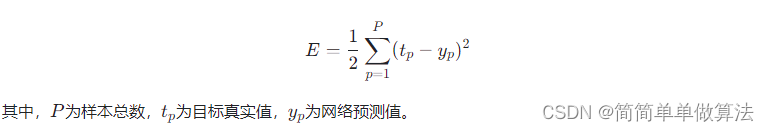
3.4反向传播算法及其误差函数
训练神经网络的关键步骤是反向传播算法,用于更新网络中的权重和偏置以减小预测误差。首先定义一个损失函数(Cost Function)或误差函数,如均方误差(MSE):
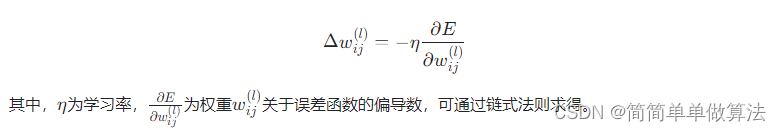
3.5 权重更新规则
反向传播过程中,通过梯度下降法更新权重和偏置,以最小化误差函数。对于第l层的第i个神经元的权重wij(l),其更新规则为:
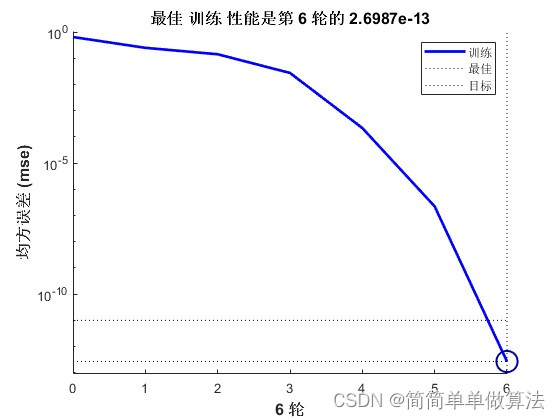
3.6 迭代训练
重复以上步骤,对整个训练集进行多次迭代,直到达到预定的停止条件(如达到最大迭代次数或者误差满足阈值),最终得到训练好的BP神经网络模型,用于城市空气质量的预测。
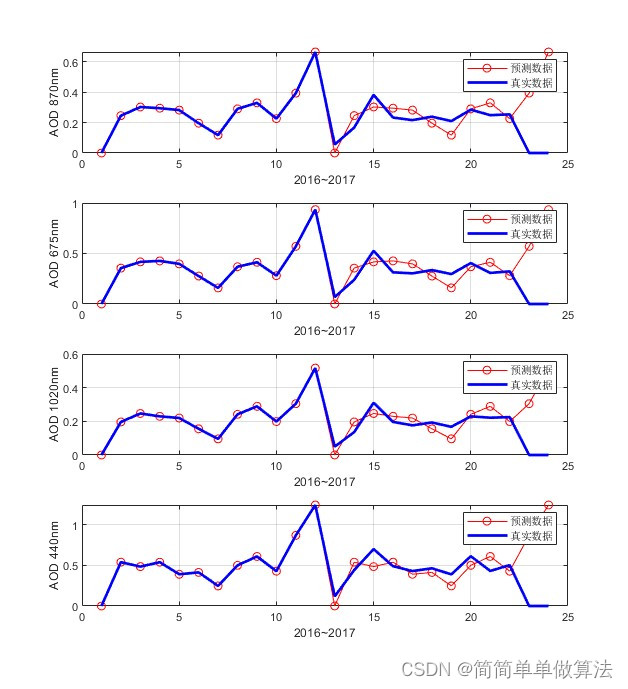
综上所述,BP神经网络通过对空气质量历史数据的学习,能够找出各因素与空气质量之间的内在规律,并通过优化权重矩阵实现对未来空气质量的预测。实际应用时还需考虑数据预处理、网络结构优化、超参数调整等问题,以提高预测的准确性和稳定性。
4.部分核心程序
D2 = dir('data\城市_20160101-20161231\*.csv');
for i = 1:length(D2)
Name = ['data\城市_20160101-20161231\',D2(i).name];
tmps = csvread(Name,1,3);
%读取北京数据
tmps2 = tmps(:,74);
L = length(tmps2);
%15个变量作为一个数据组
tmps3 = reshape(tmps2',[15,L/15]);
Data2{i} = mean(tmps3,2);
end
clear tmps tmps2 tmps3
tmp1 = 0;
indx1= 0;
tmp2 = 0;
indx2= 0;
tmp3 = 0;
indx3= 0;
tmp4 = 0;
indx4= 0;
tmp5 = 0;
indx5= 0;
tmp6 = 0;
indx6= 0;
tmp7 = 0;
indx7= 0;
tmp8 = 0;
indx8= 0;
tmp9 = 0;
indx9= 0;
tmp10= 0;
indx10= 0;
tmp11 = 0;
indx11= 0;
tmp12 = 0;
indx12= 0;
for i = 1:length(D1)
Name = ['data\城市_20160101-20161231\',D1(i).name];
month = str2num(Name(end-7:end-6));
if month == 1
tmp1 = tmp1 + Data1{i};
indx1 = indx1 + 1;
end
if month == 2
tmp2 = tmp2 + Data1{i};
indx2 = indx2 + 1;
end
if month == 3
tmp3 = tmp3 + Data1{i};
indx3 = indx3 + 1;
end
if month == 4
tmp4 = tmp4 + Data1{i};
indx4 = indx4 + 1;
end
if month == 5
tmp5 = tmp5 + Data1{i};
indx5 = indx5 + 1;
end
if month == 6
tmp6 = tmp6 + Data1{i};
indx6 = indx6 + 1;
end
if month == 7
tmp7 = tmp7 + Data1{i};
indx7 = indx7 + 1;
end
if month == 8
tmp8 = tmp8 + Data1{i};
indx8 = indx8 + 1;
end
if month == 9
tmp9 = tmp9 + Data1{i};
indx9 = indx9 + 1;
end
if month == 10
tmp10 = tmp10 + Data1{i};
indx10 = indx10 + 1;
end
if month == 11
tmp11 = tmp11 + Data1{i};
indx11 = indx11 + 1;
end
if month == 12
tmp12 = tmp12 + Data1{i};
indx12 = indx12 + 1;
end
end
%对数据按月划分,计算对应的均值
Data2016 = [tmp1/indx1,tmp2/indx2,tmp3/indx3,tmp4/indx4,tmp5/indx5,tmp6/indx6,tmp7/indx7,tmp8/indx8,tmp9/indx9,tmp10/indx10,tmp11/indx11,tmp12/indx12];
D3 = dir('data\城市_20170101-20171231\*.csv');
for i = 1:length(D3)
Name = ['data\城市_20170101-20171231\',D3(i).name];
tmps = csvread(Name,1,3);
%读取北京数据
tmps2 = tmps(:,74);
L = length(tmps2);
%15个变量作为一个数据组
tmps3 = reshape(tmps2',[15,L/15]);
Data3{i} = mean(tmps3,2);
end
clear tmps tmps2 tmps3
tmp1 = 0;
indx1= 0;
tmp2 = 0;
indx2= 0;
tmp3 = 0;
indx3= 0;
tmp4 = 0;
indx4= 0;
tmp5 = 0;
indx5= 0;
tmp6 = 0;
indx6= 0;
tmp7 = 0;
indx7= 0;
tmp8 = 0;
indx8= 0;
tmp9 = 0;
indx9= 0;
tmp10= 0;
indx10= 0;
tmp11 = 0;
indx11= 0;
tmp12 = 0;
indx12= 0;
for i = 1:length(D1)
Name = ['data\城市_20170101-20171231\',D1(i).name];
month = str2num(Name(end-7:end-6));
if month == 1
tmp1 = tmp1 + Data1{i};
indx1 = indx1 + 1;
end
if month == 2
tmp2 = tmp2 + Data1{i};
indx2 = indx2 + 1;
end
if month == 3
tmp3 = tmp3 + Data1{i};
indx3 = indx3 + 1;
end
if month == 4
tmp4 = tmp4 + Data1{i};
indx4 = indx4 + 1;
end
if month == 5
tmp5 = tmp5 + Data1{i};
indx5 = indx5 + 1;
end
if month == 6
tmp6 = tmp6 + Data1{i};
indx6 = indx6 + 1;
end
if month == 7
tmp7 = tmp7 + Data1{i};
indx7 = indx7 + 1;
end
if month == 8
tmp8 = tmp8 + Data1{i};
indx8 = indx8 + 1;
end
if month == 9
tmp9 = tmp9 + Data1{i};
indx9 = indx9 + 1;
end
if month == 10
tmp10 = tmp10 + Data1{i};
indx10 = indx10 + 1;
end
if month == 11
tmp11 = tmp11 + Data1{i};
indx11 = indx11 + 1;
end
if month == 12
tmp12 = tmp12 + Data1{i};
indx12 = indx12 + 1;
end
end
%对数据按月划分,计算对应的均值
Data2017 = [tmp1/indx1,tmp2/indx2,tmp3/indx3,tmp4/indx4,tmp5/indx5,tmp6/indx6,tmp7/indx7,tmp8/indx8,tmp9/indx9,tmp10/indx10,tmp11/indx11,tmp12/indx12];
save data.mat Data2015 Data2016 Data2017
data = [Data2015,Data2016,Data2017 ];
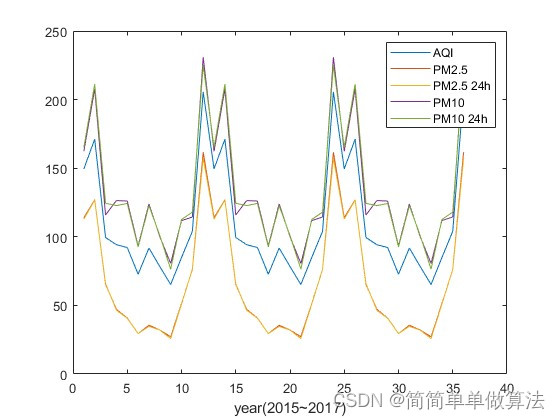
figure;
plot(data(1:5,:)');
legend('AQI','PM2.5','PM2.5 24h','PM10','PM10 24h');
xlabel('year(2015~2017)');
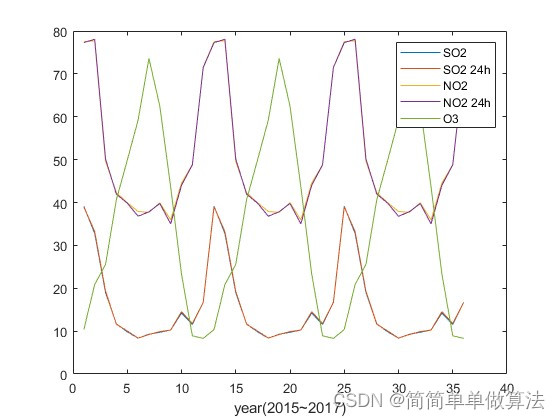
figure;
plot(data(6:10,:)');
legend('SO2','SO2 24h','NO2','NO2 24h','O3');
xlabel('year(2015~2017)');
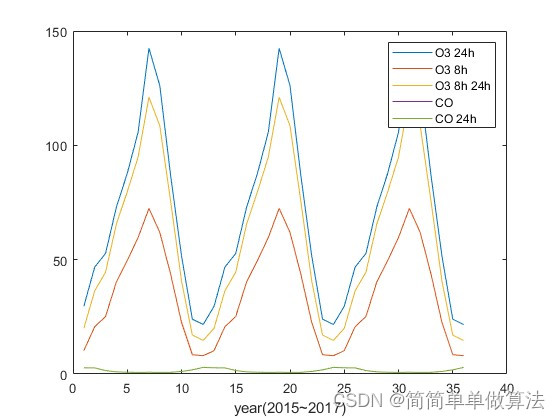
figure;
plot(data(11:15,:)');
legend('O3 24h','O3 8h','O3 8h 24h','CO','CO 24h');
xlabel('year(2015~2017)');

 浙公网安备 33010602011771号