
Software_programming_Data Visualization
2019-12-19
数据可视化的步骤
1.准备数据
2.确定目的
3.定义目标人群
4.进行可视化
确定目的
1. 更清晰地传达已经明白的事情
2. 理解尚不明确的事情
定义目标人群
1. 对该数据相关领域的了解程度
2. 观看信息图的目的
=======================================
D3.js
https://github.com/tianxuzhang/d3.v4-API-Translation
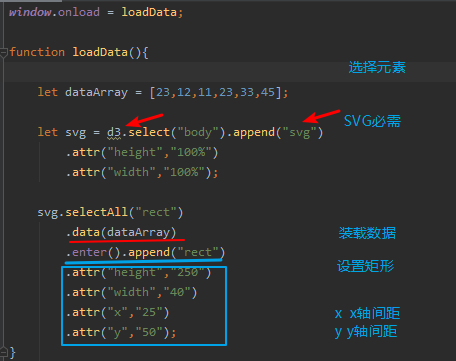
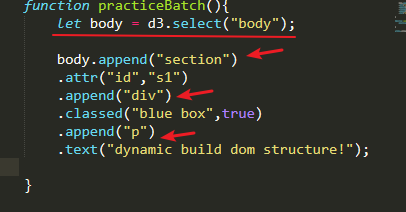
数据驱动文档 data-driven document 当函数作为参数传入修饰函数时, 其实同时还有一些其他的内置参数传入,
从而最终实现了数据驱动计算。
<script src="../script/d3.js"></script>
=====
ref : https://www.cnblogs.com/qcloud1001/p/9456000.html
2019-12-29 17:51:30
 1 function practiceAtt(){
 2     d3.select("p")
 3     .attr("foo","goo"); // set foo attribute to goo on p element
 4
 5     de.select("p")
 6     .attr("foo");       // get foo attribute on p element
 7 }
 8
 9 function practiceCls(){ // 添加,删除选定元素中的 css class
10     d3.select("p").classed("goo");
11     d3.select("p").classed("goo",true);
12
13     // 动态条件 设置
14     d3.select("p").classed("goo", function(){return false;});
15 }
16
17 function practiceStyle(){
18     d3.select("p").style("font-size");
19     d3.select("p").style("font-size", "10px");
20     d3.select("p").style("font-size",function(){
21         return parseFloat(d3.select(this).style('font-size'))+
22         10 + 'px';
23     });
24 }
25
26 function practiceText(){
27     d3.select("p").text();
28     d3.select("p").text(function(){
29         return Date()
30     });
31 }
32
33 function comprehensive(){
34     practiceAtt();
35     practiceCls();
36     practiceStyle();
37     practiceText();
38 }
39
40 window.onload = comprehensive;
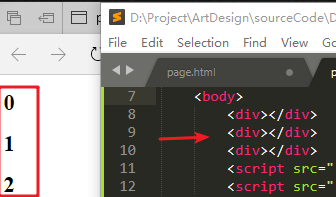
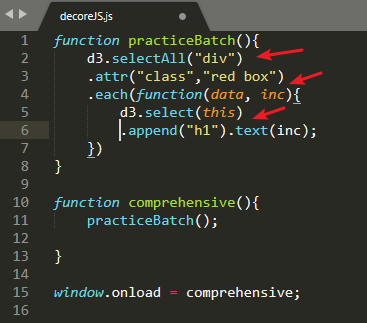
注意迭代内部, this 指向当前元素。
Dynamic constructure with js
D3.JS 组件
Core 核心功能
Scale 数值变换的相关功能
SVG 绘制SVG 元素的功能
Time 日期和事件的相关功能
Layouts 数据布局的相关功能
Geography 绘制地理信息的相关功能
Geometry 绘制集合图形的相关功能
Behaviors 处理鼠标操作的功能
Layouts 组件
数据布局
Bundle 使用 Hierachical edge bunding 算法以圆形表示将数据的层次结构
Chord 使用圆形表示各组数据之间的关系
Force 使用 Force-directed 算法表示网络结构
Hierarchy 表示数据层次结构的抽象布局
Cluster 使用 Dendrogram 表示树形结构
Pack 使用 Circle Packing 表示数据的层次结构
Partition 使用放射状表示树形结构
Tree 使用 Reingold-Tilford "tidy" algorithm表示树形结构
Treemap 使用 treemap 表示树形结构
Histogram 表示柱状图
Pie 表示饼图
Stack 表示堆叠图
==============
Behaviors 组件
交互式组件
data visualization D3 Layout
let layoutVar = d3.layout.force().nodes(xxx).links(xxxx).size([width, height]);
layout() 方法,获取提供 Force 布局功能的Force对象。 为了以后能重用,保存在变量中。
调用node() 方法,注册Force对象对应的节点信息, 然后调用links 方法, 注册链接信息,
如果表示链接信息的 JSON 格式与 Force 布局要求的格式不符, Javascript 就会报错。
size 方法, 指定布局的尺寸大小。

 浙公网安备 33010602011771号