
python 使用三种常用的工具包处理图片
matplotlib,PIL(Pillow),Opencv三种常用的作图方式。
使用matplotlib画图,很棒,matplotlib 是python最著名的2D绘图库,它提供了一整套和matlab相似的命令API,十分适合交互式地进行制图。而且也可以方便地将它作为绘图控件,嵌入GUI应用程序中。通过简单的绘图语句,就可以绘制出高质量的图了。
pip install matplotlib
from PIL import Image
import matplotlib.pyplot as plt
img=Image.open('d:/dog.png')
plt.figure("dog")
plt.imshow(img)
plt.show()
figure默认是带axis的,如果没有需要,我们可以关掉
plt.axis('off')
print(img.size)  #图片的尺寸
print(img.mode ) #图片的模式
print(img.format)  #图片的格式
img.save('d:/dog.jpg') #这行代码不仅能保存图片,还是转换格式,如本例中,就由原来的png图片保存为了jpg图片。
这里在centos下跑pip install matplotlib 会出错,提示让你升级pip,但是centos下默认安装的是python2.7 于是pip install --upgrade pip 但是仍然报错
去了官网https://matplotlib.org/users/installing.html
找到解决方法,
yum install python2-matplotlib
如果是python3的话就 yum install python3-matplotlib 不过我想直接pip install matplotlib 也没问题应该。
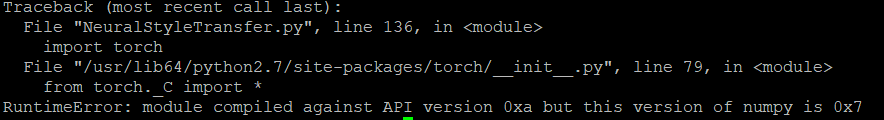
这个应该是numpy需要升级了。
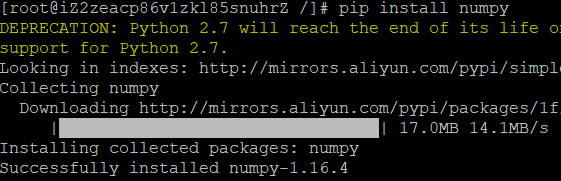
pip install numpy --upgrade
如果还不行,pip install numpy --upgrade --ignore-installed
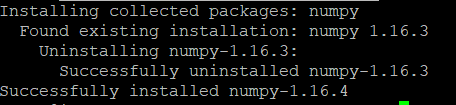
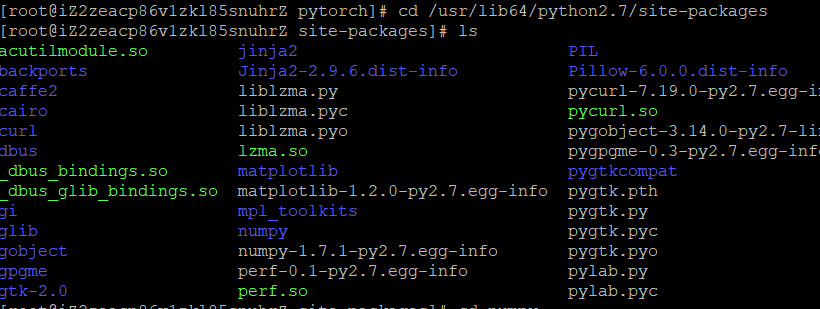
再次安装pip install numpy
说无法安装。。已经存在,奇怪,明明已经卸载了。(实际上下面两行是执行不了的,只是想说明可以查看path)
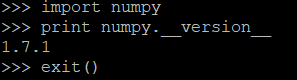
import numpy
print numpy.__path__
找到numpy的物理路径,手动强制删掉,rm -rf numpy
再次安装,成功了。
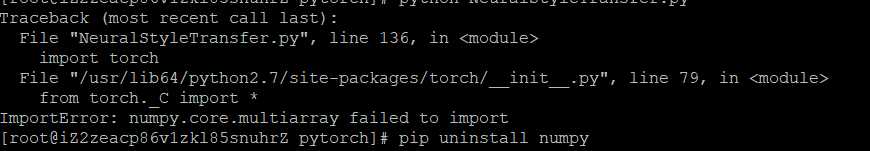
执行,又报错了。
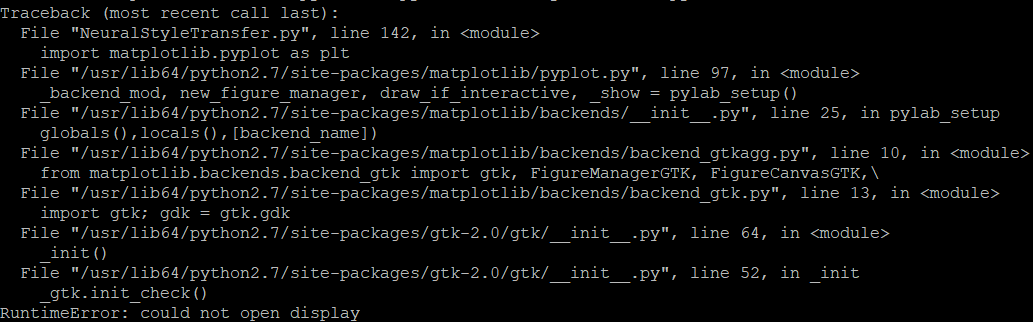

又双报错了。
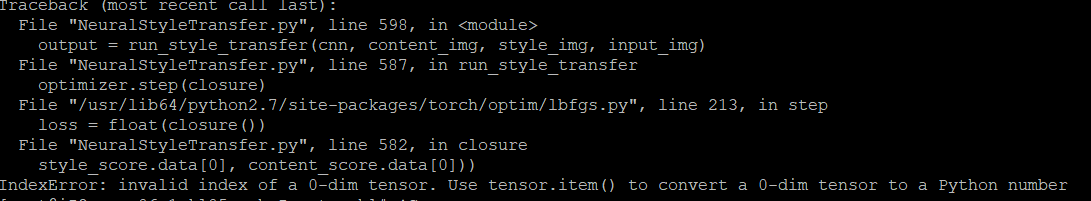
style_score.data[0] 改为style_score.item()
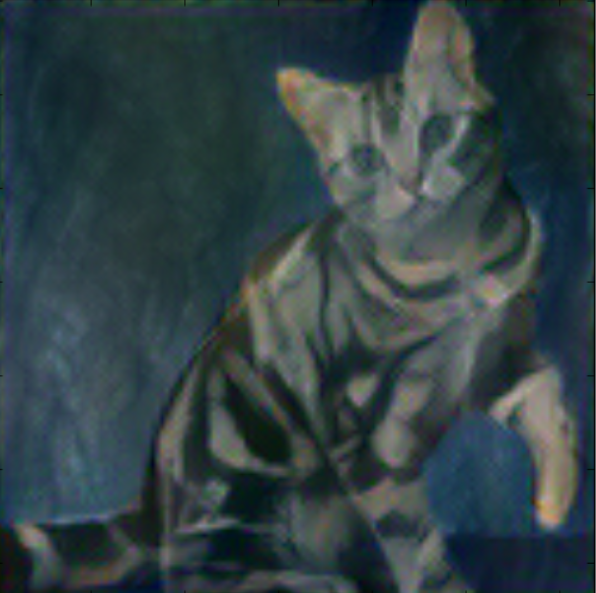
终于运行成功了,其实我只是找了份画风迁移的代码,运行一下而已。。原理嘛就是把一张图的内容和风格(纹理style)分开提取特征,然后相互杂交,是不是这个理儿?
想到这里,我觉得有很多东西不是一下子就要懂得很深入,可以先了解它是什么,能干什么,至于为什么等以后需要知道的时候再知道也不迟,因为要补的知识实在太多,脑子装不下要爆炸。
人类一思考,上天就想笑,于是又报错了
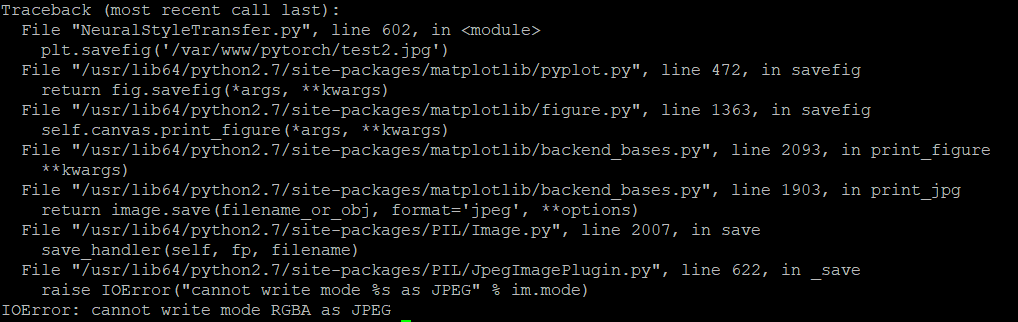
于是改成png,除去了A透明度,以为终于可以了。
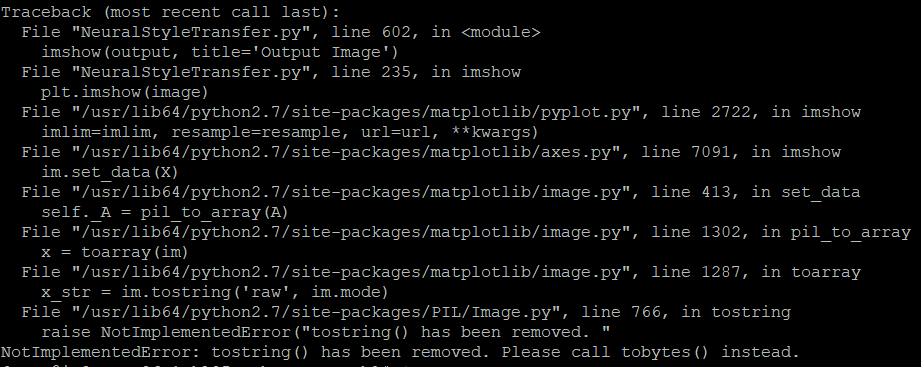
跑去改了matplotlib的源码,把tostring()改成了tobytes(),这只毕加索风格的猫如何?
使用python进行数字图片处理,还得安装Pillow包。虽然python里面自带一个PIL(python images library), 但这个库现在已经停止更新了,所以使用Pillow, 它是由PIL发展而来的。
pip install Pillow
from PIL import Image
img=Image.open('d:/dog.png')
img.show()
import matplotlib.pyplot as plt

#创建新的figure
fig = plt.figure()

#必须通过add_subplot()创建一个或多个绘图
ax = fig.add_subplot(221)

#绘制2x2两行两列共四个图,编号从1开始
ax1 = fig.add_subplot(221)
ax2 = fig.add_subplot(222)
ax3 = fig.add_subplot(223)
ax4 = fig.add_subplot(224)

#图片的显示
plt.show()
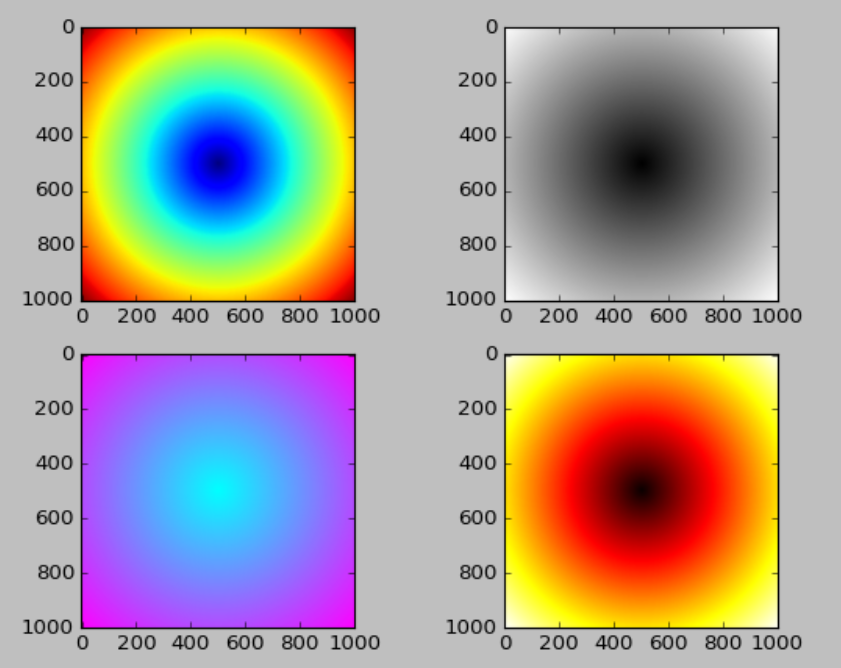
热图(heatmap)是数据分析的常用方法,通过色差、亮度来展示数据的差异、易于理解。Python在Matplotlib库中,调用imshow()函数实现热图绘制。
#coding=utf-8
import matplotlib.pyplot as plt
import numpy as np

points = np.arange(-5,5,0.01)

xs,ys = np.meshgrid(points,points)

z = np.sqrt(xs**2 + ys**2)

#创建新的figure
fig = plt.figure()

#绘制2x2两行两列共四个图,编号从1开始
ax = fig.add_subplot(221)
ax.imshow(z)

ax = fig.add_subplot(222)
#使用自定义的colormap(灰度图)
ax.imshow(z,cmap=plt.cm.gray)

ax = fig.add_subplot(223)
#使用自定义的colormap
ax.imshow(z,cmap=plt.cm.cool)

ax = fig.add_subplot(224)
#使用自定义的colormap
ax.imshow(z,cmap=plt.cm.hot)

#图片的显示
plt.show()
Opencv 的做法
import cv2 as cv
# load
img = cv.imread(imagepath)
# shape=(height, width, channel)
h,w,c = img.shape
# show
cv.imshow('window_title', img)
# save
cv.imwrite(savepath, img)
最后,matplotlib的官网,有很多酷炫的图和源码,非常推荐。
https://matplotlib.org/gallery/index.html
