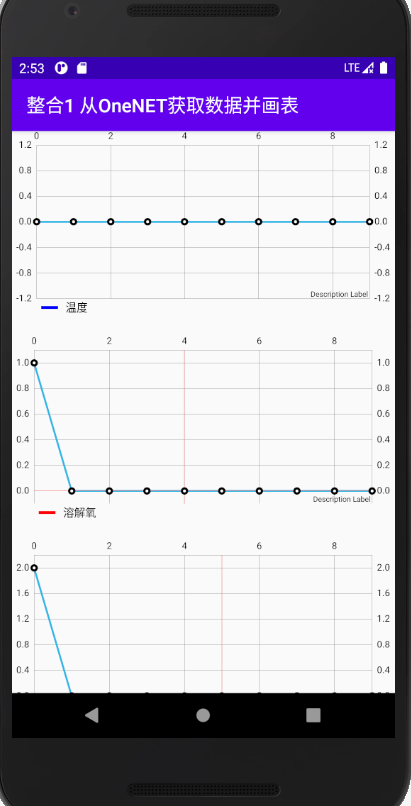
获取OneNET云平台数据并显示折线图
使用到的框架和技术 OkHttpGo、FastJson、MpAndroidChart
有了前两篇随笔的基础后,现在将获取到的数据显示到折线图中,获取到的数据会暂存在ArrayList中,因为这些数据将会被用到折线图中的,所以Array中<>需要写Entry(MpAndroidChart中有定义,不同的图不同的实体)。需要获取的传感器有5个,所以一开始用for循环add(增添)5个数据,在每次线程中再去set它,规定了下标号0是温度,1是溶解氧,2是电导率,3是酸碱度,4是浊度。本次代码实时数据更新部分主要参照MpAndroidChart中的RealtimeLineChartActivity文件https://github.com/PhilJay/MPAndroidChart/blob/master/MPChartExample/src/main/java/com/xxmassdeveloper/mpchartexample/RealtimeLineChartActivity.java。这次的例程会间隔一段时间再插入新的数据,最多只会显示10个点。(效果图一开始的是赋初值,在init函数有写到,不同的传感器赋不同的初值,0~4,但是没用单片机上传数据了,所以云平台的数据都是0)
  1 package com.example.helloworld.zhenghe1;
  2
  3 import androidx.annotation.NonNull;
  4 import androidx.appcompat.app.AppCompatActivity;
  5
  6 import android.content.Context;
  7 import android.graphics.Color;
  8 import android.os.Bundle;
  9 import android.provider.Settings;
 10 import android.view.View;
 11 import android.view.ViewGroup;
 12 import android.widget.ArrayAdapter;
 13 import android.widget.ListView;
 14 import android.widget.Toast;
 15
 16 import com.alibaba.fastjson.JSONArray;
 17 import com.alibaba.fastjson.JSONObject;
 18 import com.example.helloworld.R;
 19 import com.github.mikephil.charting.charts.LineChart;
 20 import com.github.mikephil.charting.components.Legend;
 21 import com.github.mikephil.charting.components.LegendEntry;
 22 import com.github.mikephil.charting.components.YAxis;
 23 import com.github.mikephil.charting.data.Entry;
 24 import com.github.mikephil.charting.data.LineData;
 25 import com.github.mikephil.charting.data.LineDataSet;
 26 import com.github.mikephil.charting.interfaces.datasets.ILineDataSet;
 27 import com.github.mikephil.charting.utils.ColorTemplate;
 28 import com.lzy.okgo.OkGo;
 29 import com.lzy.okgo.callback.StringCallback;
 30 import com.lzy.okgo.model.Response;
 31
 32 import java.text.DecimalFormat;
 33 import java.util.ArrayList;
 34 import java.util.List;
 35
 36 public class ZhengHe1Main extends AppCompatActivity {
 37
 38     /**StoreValue是用于储存OneNET获取下来传感器的数据
 39      * 其中 [0]是温度[1]溶解氧[2]电导率[3]ph[4]浊度
 40      *该arraylist一开始在赋值为0,然在线程中set重新赋值*/
 41     ArrayList<Float> StoreValue = new ArrayList<>();
 42     LineChart lineChartWenDu,lineChartDo,lineChartPh,lineChartTDS,lineChartZhuoDu;
 43     private String url = "https://api.heclouds.com/devices/523698851/datapoints";
 44
 45     @Override
 46     protected void onCreate(Bundle savedInstanceState) {
 47         super.onCreate(savedInstanceState);
 48         setContentView(R.layout.activity_zheng_he1_main);
 49         setTitle("整合1 从OneNET获取数据并画表");
 50
 51         init();//运行初始化函数
 52         feedMultiple();//线程
 53     }
 54
 55     /**
 56      *初始化函数
 57      *@author home
 58      *@time 2021/3/1 9:38
 59     */
 60     private void init() {
 61         for(int i=0;i<5;i++) {//初始化arrylist赋值 先增加值,再修改值
 62             StoreValue.add(i,(float) i);
 63         }
 64
 65         lineChartWenDu = findViewById(R.id.chart_wendu);
 66         lineChartDo = findViewById(R.id.chart_do);
 67         lineChartTDS = findViewById(R.id.chart_tds);
 68         lineChartPh = findViewById(R.id.chart_ph);
 69         lineChartZhuoDu = findViewById(R.id.chart_zhuodu);
 70
 71         //设置数据部分(一定要为不同的传感器设置不同的LineData)
 72         LineData dataWendu = new LineData();
 73         dataWendu.setValueTextColor(Color.BLACK);
 74         lineChartWenDu.setData(dataWendu);
 75
 76         LineData dataDo = new LineData();
 77         dataDo.setValueTextColor(Color.BLACK);
 78         lineChartDo.setData(dataDo);
 79
 80         LineData dataTds = new LineData();
 81         dataTds.setValueTextColor(Color.BLACK);
 82         lineChartTDS.setData(dataTds);
 83
 84         LineData dataPh = new LineData();
 85         dataPh.setValueTextColor(Color.BLACK);
 86         lineChartPh.setData(dataPh);
 87
 88         LineData dataZhuoDu = new LineData();
 89         dataZhuoDu.setValueTextColor(Color.BLACK);
 90         lineChartZhuoDu.setData(dataZhuoDu);
 91
 92         getJsonFromOneNet();
 93         lineChartSetting();//设置表格样式
 94
 95         lineChartWenDu.invalidate();
 96         lineChartDo.invalidate();
 97         lineChartPh.invalidate();
 98         lineChartTDS.invalidate();
 99         lineChartZhuoDu.invalidate();
100     }
101
102     /**
103      *设置表格的各种属性
104      *@author home
105      *@time 2021/2/28 13:01
106     */
107     private void lineChartSetting() {
108         Legend legendWenDu = lineChartWenDu.getLegend();
109         Legend legendDo = lineChartDo.getLegend();
110         Legend legendTds = lineChartTDS.getLegend();
111         Legend legendPh = lineChartPh.getLegend();
112         Legend legendZhuoDu = lineChartZhuoDu.getLegend();
113
114         legendWenDu.setEnabled(true);
115         legendWenDu.setTextColor(Color.BLACK);
116         legendWenDu.setTextSize(12);
117         legendWenDu.setForm(Legend.LegendForm.LINE);
118         legendWenDu.setFormSize(18);
119         legendWenDu.setXEntrySpace(15);
120         legendWenDu.setFormToTextSpace(8);
121
122         legendDo.setEnabled(true);
123         legendDo.setTextColor(Color.BLACK);
124         legendDo.setTextSize(12);
125         legendDo.setForm(Legend.LegendForm.LINE);
126         legendDo.setFormSize(18);
127         legendDo.setXEntrySpace(15);
128         legendDo.setFormToTextSpace(8);
129
130         legendTds.setEnabled(true);
131         legendTds.setTextColor(Color.BLACK);
132         legendTds.setTextSize(12);
133         legendTds.setForm(Legend.LegendForm.LINE);
134         legendTds.setFormSize(18);
135         legendTds.setXEntrySpace(15);
136         legendTds.setFormToTextSpace(8);
137
138         legendPh.setEnabled(true);
139         legendPh.setTextColor(Color.BLACK);
140         legendPh.setTextSize(12);
141         legendPh.setForm(Legend.LegendForm.LINE);
142         legendPh.setFormSize(18);
143         legendPh.setXEntrySpace(15);
144         legendPh.setFormToTextSpace(8);
145
146         legendZhuoDu.setEnabled(true);
147         legendZhuoDu.setTextColor(Color.BLACK);
148         legendZhuoDu.setTextSize(12);
149         legendZhuoDu.setForm(Legend.LegendForm.LINE);
150         legendZhuoDu.setFormSize(18);
151         legendZhuoDu.setXEntrySpace(15);
152         legendZhuoDu.setFormToTextSpace(8);
153
154         LegendEntry[] legendEntriesWenDu = new LegendEntry[1];
155         LegendEntry entryWenDu = new LegendEntry();
156         entryWenDu.formColor = Color.BLUE;//不设置颜色将不会出现
157         entryWenDu.label = "温度";
158         legendEntriesWenDu[0] = entryWenDu;
159
160         LegendEntry[] legendEntriesDo = new LegendEntry[1];
161         LegendEntry entryDo = new LegendEntry();
162         entryDo.formColor = Color.RED;
163         entryDo.label = "溶解氧";
164         legendEntriesDo[0] = entryDo;
165
166         LegendEntry[] legendEntriesTds = new LegendEntry[1];
167         LegendEntry entryTds = new LegendEntry();
168         entryTds.formColor = Color.GREEN;
169         entryTds.label = "电导率(TDS)";
170         legendEntriesTds[0] = entryTds;
171
172         LegendEntry[] legendEntriesPh = new LegendEntry[1];
173         LegendEntry entryPh = new LegendEntry();
174         entryPh.formColor = Color.YELLOW;
175         entryPh.label = "PH";
176         legendEntriesPh[0] = entryPh;
177
178        LegendEntry[] legendEntriesZhuoDu = new LegendEntry[1];
179        LegendEntry entryZhuoDu = new LegendEntry();
180        entryZhuoDu.formColor = Color.DKGRAY;
181        entryZhuoDu.label = "浊度";
182        legendEntriesZhuoDu[0] = entryZhuoDu;
183
184         legendWenDu.setCustom(legendEntriesWenDu);
185         legendDo.setCustom(legendEntriesDo);
186         legendTds.setCustom(legendEntriesTds);
187         legendPh.setCustom(legendEntriesPh);
188         legendZhuoDu.setCustom(legendEntriesZhuoDu);
189     }
190
191     /**
192      *添加不同传感器的数据
193      *@author home
194      *@time 2021/2/28 16:56
195     */
196     private void addEntry() {
197
198         LineData dataWenDu = lineChartWenDu.getData();
199         LineData dataDo = lineChartDo.getData();
200         LineData dataTds = lineChartTDS.getData();
201         LineData dataPh = lineChartPh.getData();
202         LineData dataZhuoDu = lineChartZhuoDu.getData();
203
204         //温度
205         if (dataWenDu != null) {
206
207             ILineDataSet setWenDu = dataWenDu.getDataSetByIndex(0);
208             // set.addEntry(...); // can be called as well
209
210             if (setWenDu == null) {
211                 setWenDu = createSet();
212                 dataWenDu.addDataSet(setWenDu);
213             }
214
215 //            StoreValue.set(0,(float) 0);//测试用 看下数据是否能显示
216             dataWenDu.addEntry(new Entry(setWenDu.getEntryCount(), StoreValue.get(0)),0);
217             dataWenDu.notifyDataChanged();
218
219             // let the chart know it's data has changed
220             lineChartWenDu.notifyDataSetChanged();
221             // limit the number of visible entries
222             lineChartWenDu.setVisibleXRangeMaximum(120);
223             // chart.setVisibleYRange(30, AxisDependency.LEFT);
224
225             // move to the latest entry
226             lineChartWenDu.moveViewToX(dataWenDu.getEntryCount());
227
228             // this automatically refreshes the chart (calls invalidate())
229             // chart.moveViewTo(data.getXValCount()-7, 55f,
230             // AxisDependency.LEFT);
231         }
232
233         //DO
234         if (dataDo != null) {
235
236             ILineDataSet setDo = dataDo.getDataSetByIndex(0);
237             // set.addEntry(...); // can be called as well
238
239             if (setDo == null) {
240                 setDo = createSet();
241                 dataDo.addDataSet(setDo);
242             }
243
244 //            StoreValue.set(1,(float) 1);//测试用 看下数据是否能显示
245             dataDo.addEntry(new Entry(setDo.getEntryCount(), StoreValue.get(1)),0);
246             dataDo.notifyDataChanged();
247
248             lineChartDo.notifyDataSetChanged();
249             lineChartDo.setVisibleXRangeMaximum(120);
250             lineChartDo.moveViewToX(dataDo.getEntryCount());
251         }
252
253         //TDS
254         if (dataTds != null) {
255
256             ILineDataSet setTds = dataTds.getDataSetByIndex(0);
257             // set.addEntry(...); // can be called as well
258
259             if (setTds == null) {
260                 setTds = createSet();
261                 dataTds.addDataSet(setTds);
262             }
263
264 //            StoreValue.set(2,(float) 2);//测试用 看下数据是否能显示
265             dataTds.addEntry(new Entry(setTds.getEntryCount(), StoreValue.get(2)),0);
266             dataTds.notifyDataChanged();
267
268             lineChartTDS.notifyDataSetChanged();
269             lineChartTDS.setVisibleXRangeMaximum(120);
270             lineChartTDS.moveViewToX(dataTds.getEntryCount());
271         }
272
273         //Ph
274         if (dataPh != null) {
275
276             ILineDataSet setPh = dataPh.getDataSetByIndex(0);
277             // set.addEntry(...); // can be called as well
278
279             if (setPh == null) {
280                 setPh = createSet();
281                 dataPh.addDataSet(setPh);
282             }
283
284 //            StoreValue.set(3,(float) 3);//测试用 看下数据是否能显示
285             dataPh.addEntry(new Entry(setPh.getEntryCount(), StoreValue.get(3)),0);
286             dataPh.notifyDataChanged();
287
288             lineChartPh.notifyDataSetChanged();
289             lineChartPh.setVisibleXRangeMaximum(120);
290             lineChartPh.moveViewToX(dataPh.getEntryCount());
291         }
292
293         //浊度
294         if (dataZhuoDu != null) {
295
296             ILineDataSet setZhuoDu = dataZhuoDu.getDataSetByIndex(0);
297             // set.addEntry(...); // can be called as well
298
299             if (setZhuoDu == null) {
300                 setZhuoDu = createSet();
301                 dataZhuoDu.addDataSet(setZhuoDu);
302             }
303
304 //            StoreValue.set(4,(float) 4);//测试用 看下数据是否能显示
305             dataZhuoDu.addEntry(new Entry(setZhuoDu.getEntryCount(), StoreValue.get(4)),0);
306             dataZhuoDu.notifyDataChanged();
307
308             lineChartZhuoDu.notifyDataSetChanged();
309             lineChartZhuoDu.setVisibleXRangeMaximum(120);
310             lineChartZhuoDu.moveViewToX(dataZhuoDu.getEntryCount());
311         }
312     }
313
314
315
316     private LineDataSet createSet() {
317
318         LineDataSet set = new LineDataSet(null, "Dynamic Data");
319         set.setAxisDependency(YAxis.AxisDependency.LEFT);
320         set.setColor(ColorTemplate.getHoloBlue());
321         set.setCircleColor(Color.BLACK);
322         set.setLineWidth(2f);
323         set.setCircleRadius(4f);
324         set.setFillAlpha(65);
325         set.setFillColor(ColorTemplate.getHoloBlue());
326         set.setHighLightColor(Color.rgb(244, 117, 117));
327         set.setValueTextColor(Color.BLACK);
328         set.setValueTextSize(9f);
329         set.setDrawValues(false);
330         return set;
331     }
332
333     private Thread thread;
334
335     private void feedMultiple() {
336
337         if (thread != null)
338             thread.interrupt();
339
340         final Runnable runnable = new Runnable() {
341
342             @Override
343             public void run() {
344                 //getJsonFromOneNet();
345                 addEntry();//更新数据
346             }
347         };
348
349         thread = new Thread(new Runnable() {
350
351             @Override
352             public void run() {
353                 for (int i = 0; i < 10; i++) {
354
355                     // Don't generate garbage runnables inside the loop.
356                     runOnUiThread(runnable);
357
358                     try {
359                         Thread.sleep(5000);
360                     } catch (InterruptedException e) {
361                         e.printStackTrace();
362                     }
363                 }
364             }
365         });
366
367         thread.start();
368     }
369
370     @Override
371     protected void onDestroy() {
372         super.onDestroy();
373         //Activity销毁时,取消网络请求
374         OkGo.getInstance().cancelTag(this);
375     }
376
377     /**
378      *OkHttpGo与FastJson结合,从OneNET云平台获取数据,并存入arraylist中
379      *@author home
380      *@time 2021/2/28 14:44
381     */
382     private void getJsonFromOneNet() {
383
384         OkGo.<String>get(url)//文档说的第一行泛型一定要添加是指这里
385                 .headers("api-key", "4VdbaFeRQZRwaSTWNhWxb2UEHaw=")//设备的api-key
386                 .headers("Content-Type","application/json")
387                 .tag(this)
388                 .execute(new StringCallback() {
389                     @Override
390                     public void onSuccess(Response<String> response) {//请求成功回调onSuccess方法
391
392                         String value = "", id = "";
393                         int count = 0;
394
395                         JSONObject jsonObjectData = JSONObject.parseObject(response.body()).getJSONObject("data");//获取json对象后再获取json对象,即第二层data
396                         count = jsonObjectData.getIntValue("count");//count是Datastreams数组的下标值
397                         JSONArray jsonArrayDatastreams = jsonObjectData.getJSONArray("datastreams");//获取json数组即datastearms
398
399                         for(int j = 0; j < count; j++) {//遍历Datastreams数组
400                             JSONObject jsonObjectIndex = jsonArrayDatastreams.getJSONObject(j);
401                             id = jsonObjectIndex.getString("id");
402                             JSONArray jsonArrayDatapoints = jsonObjectIndex.getJSONArray("datapoints");
403                             JSONObject jsonObjectValue = jsonArrayDatapoints.getJSONObject(0);//Datapoints数组只有一个元素(对象),所以下标是1
404                             value = jsonObjectValue.getString("value");
405                             switch (id) {
406                                 case "3303_0_5700":    //温度
407                                     //System.out.println("温度" + value + id);
408                                     //tv_wendu.setText("温度" + value + "\t设备号" + id);
409                                     float a1 = Float.parseFloat(value);
410                                     StoreValue.set(0,a1);
411                                     System.out.println("温度" + StoreValue.get(0));
412                                     break;
413                                 case "3300_0_5700":     //溶解氧
414                                     System.out.println("DO" + value + id);
415                                     float a2 = Float.parseFloat(value);
416                                     StoreValue.set(1,a2);
417                                     break;
418                                 case "3327_0_5700":     //电导率
419                                     System.out.println("电导率" + value + id);
420                                     float a3 = Float.parseFloat(value);
421                                     StoreValue.set(2,a3);
422                                     break;
423                                 case "3326_0_5700":     //ph
424                                     System.out.println("ph" + value + id);
425                                     float a4 = Float.parseFloat(value);
426                                     StoreValue.set(3,a4);
427                                     break;
428                                 case "3300_1_5700":     //浊度
429                                     System.out.println("浊度" + value + id);
430                                     float a5 = Float.parseFloat(value);
431                                     StoreValue.set(4,a5);
432                                     break;
433                             }
434                         }
435                     }
436
437                     @Override
438                     public void onError(Response<String> response) {
439                         Toast.makeText(getApplicationContext(), "接口请求错误!", Toast.LENGTH_LONG).show();
440                     }
441                 });
442     }
443 }
 1 <?xml version="1.0" encoding="utf-8"?>
 2 <ScrollView xmlns:android="http://schemas.android.com/apk/res/android"
 3     android:layout_width="match_parent"
 4     android:layout_height="match_parent">
 5
 6     <LinearLayout
 7         android:layout_width="match_parent"
 8         android:layout_height="match_parent"
 9         android:orientation="vertical">
10
11         <com.github.mikephil.charting.charts.LineChart
12             android:id="@+id/chart_wendu"
13             android:layout_width="match_parent"
14             android:layout_height="200dp" />
15
16         <com.github.mikephil.charting.charts.LineChart
17             android:layout_marginTop="20dp"
18             android:id="@+id/chart_do"
19             android:layout_width="match_parent"
20             android:layout_height="200dp" />
21
22         <com.github.mikephil.charting.charts.LineChart
23             android:layout_marginTop="20dp"
24             android:id="@+id/chart_tds"
25             android:layout_width="match_parent"
26             android:layout_height="200dp" />
27
28
29         <com.github.mikephil.charting.charts.LineChart
30             android:layout_marginTop="20dp"
31             android:id="@+id/chart_ph"
32             android:layout_width="match_parent"
33             android:layout_height="200dp" />
34
35         <com.github.mikephil.charting.charts.LineChart
36             android:layout_marginTop="20dp"
37             android:id="@+id/chart_zhuodu"
38             android:layout_width="match_parent"
39             android:layout_height="200dp" />
40
41     </LinearLayout>
42
43
44 </ScrollView>

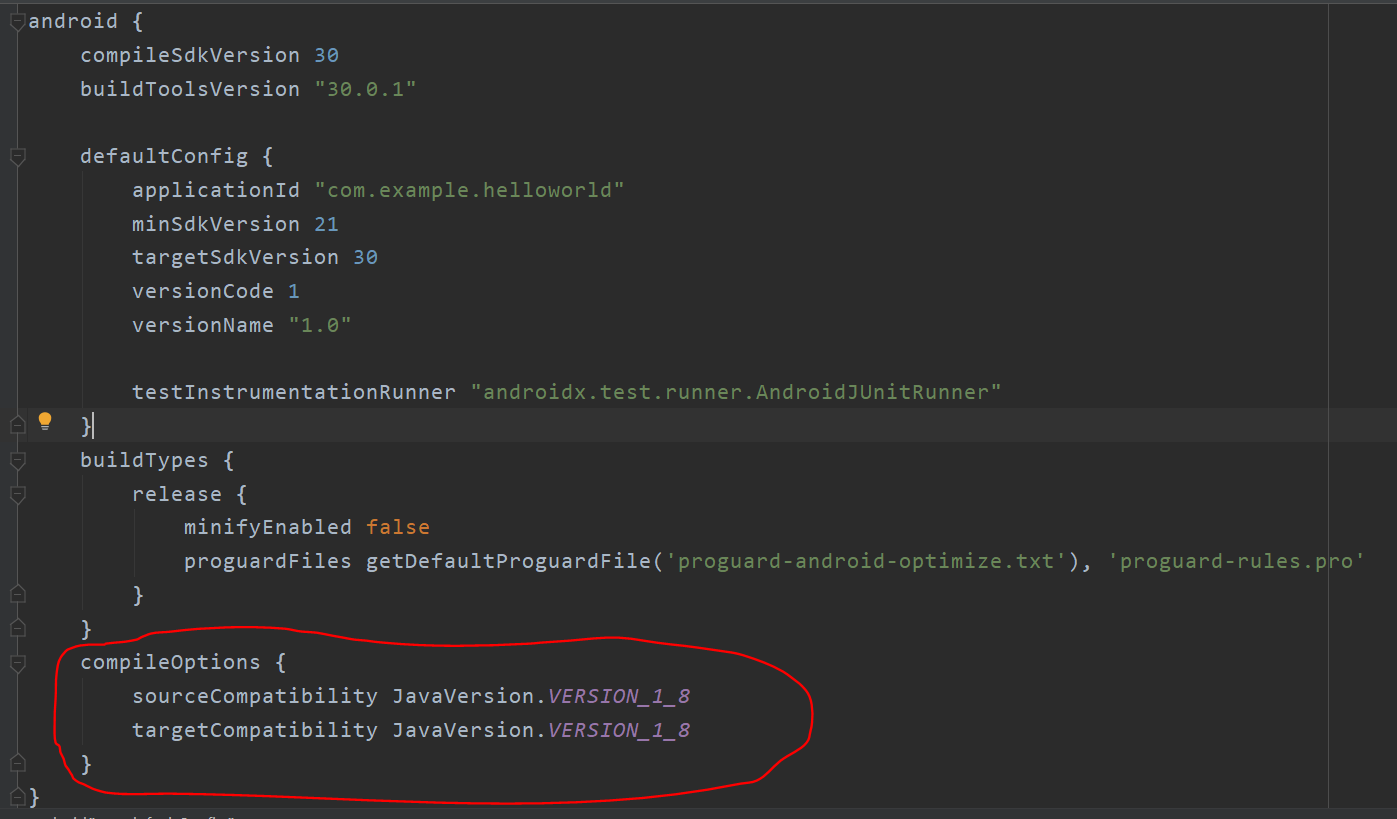
打包apk发送到手机运行时,提示了如下错误 Static interface methods are only supported starting with Android N ,参照了博客https://blog.csdn.net/z1web/article/details/88787382,在bulid.gradle(app)中的...加入 就可以了。
```
compileOptions {
    sourceCompatibility JavaVersion.VERSION_1_8
    targetCompatibility JavaVersion.VERSION_1_8
}
```

posted on 2021-03-01 11:03 stuMartin 阅读(2151) 评论(0) 编辑 收藏 举报


