目标检测评价指标(mAP)
常见指标
precision预测出的所有目标中正确的比例 (true positives / true positives + false positives).recall被正确定位识别的目标占总的目标数量的比例 (true positives/(true positives + false negatives)).
一般情况下模型不够理想,准确率高、召回率低,或者召回率低、准确率高。如果做疾病监测、反垃圾,则是保准确率的条件下,提升召回率。如果是做搜索,那就是保证召回的情况下提升准确率。[1]
Precision和Recall的计算图示如下:
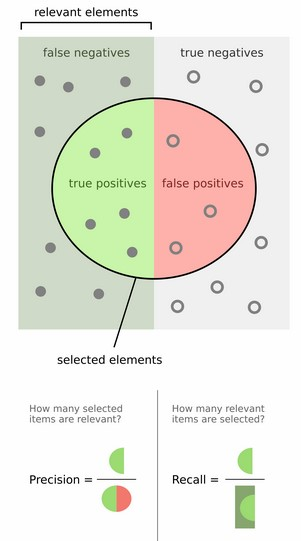
以行人检测为例,精度就是检测出来的行人中确实是行人的所占的百分比;Recall就是正确检出的行人数量占行人总数的百分比,Recall=100%表示没有漏检;这两个常常是一对矛盾,通常我们总是希望既没有虚景也不会发生漏检的情况,也就是Precision和Recall均为100%的状况。
F1 score通常我们使用precision和recall两个指标来衡量模型的好坏,但是同时要权衡这两个量,影响我们做决策的速度.可以使用F1 score来组合这两个量(又称F score,F measure,名称F没有什么意义):
F1 score 是 \(F=1/(\lambda{1\over P}+(1-\lambda){1\over R})\) 的简化版(\(\lambda=0.5\)).
P和R的值均是越大越好,因此F1 score也越大结果越好.
AUCROC 曲线下的面积,面积越大,分类效果越好.ROC横轴为假正率(FP,false positive),纵轴为真正率(TP,true positive)。 通过给分类器设置不同的置信度阈值得到多组(FP,TP)数据绘制成ROC 曲线。ROC 曲线如下图所示:
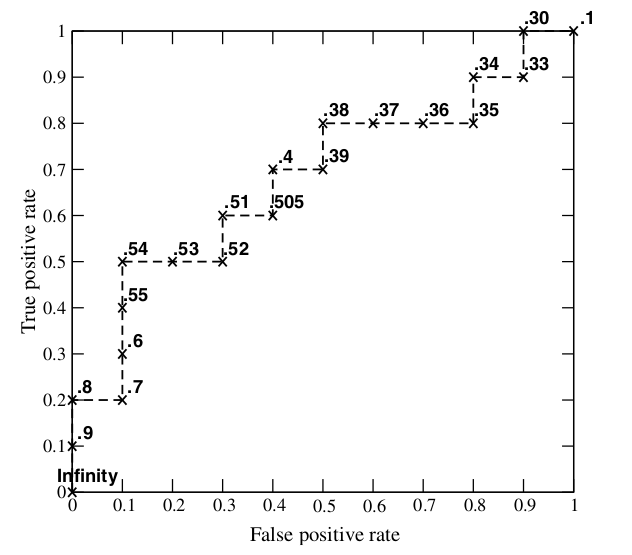
AUC 的含义:AUC值是一个概率值,当你随机挑选一个正样本以及一个负样本,当前的分类算法根据计算得到的Score值将这个正样本排在负样本前面的概率就是AUC值。当然,AUC值越大,当前的分类算法越有可能将正样本排在负样本前面,即能够更好的分类。
为什么使用ROC曲线?
评价标准已有很多,为什么还要使用ROC和AUC呢?因为ROC曲线有个很好的特性:当测试集中的正负样本的分布变化的时候,ROC曲线能够保持不变。在实际的数据集中经常会出现类不平衡(class imbalance)现象,即负样本比正样本多很多(或者相反),而且测试数据中的正负样本的分布也可能随着时间变化。[2]
loss_bbox预测边框和真实边框的坐标之间的差别,如采用smooth L1 loss计算.mAP对于每一类计算平均精度(AP,average precision),然后计算所有类的均值。mAP 综合考量了P、R,解决P,R的单点值局限性。PR曲线与ROC曲线类似,曲线下面积越大越好,因此我们定义PR曲线下面积为:
当然,这种积分只是一种理想的计算方式, 实际中可采用 Approximated Average precision: \(\sum_{k=1}^N P(k)\Delta r(k)\). 表示当识别出k张图片(或目标)时准确率与召回率的变化量(从k-1变化到k)的乘积累加和.
另一种度量性能的标准:Interpolated Average Precision。这一新的算法不再使用P(k),而是使用:\(\sum_{k=1}^N \max_{\tilde{k}\ge k}P(\tilde{k})\Delta r(k)\).
使用Interpolated Average Precision算出的Average Precision值明显要比Approximated Average Precision的方法算出的要高。
很多文献都是用Interpolated Average Precision 作为度量方法,并且直接称算出的值为Average Precision 。PASCAL Visual Objects Challenge从2007年开始就是用这一度量制度,他们认为这一方法能有效地减少Precision-recall 曲线中的抖动。[1:1]
mAP (VOC)
在论文中常看到top-5 xxx, mAP@0.5等,下面对此作出解释.
首先用训练好的模型得到所有测试样本的confidence score.接下来对confidence score排序,然后计算precision和recall.
计算precision和recall时可以只计算按confidence score排序后top-n的样本,称为top-n precision/recall.
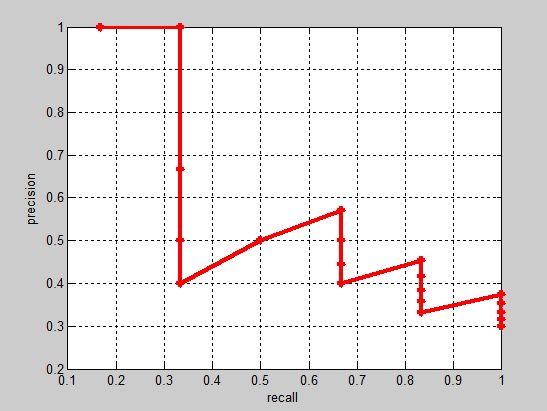
实际多类别分类任务中,我们通常不满足只通过top-5来衡量一个模型的好坏,而是需要知道从top-1到top-N(N是所有测试样本个数,本文中为20)对应的precision和recall。显然随着我们选定的样本越来也多,recall一定会越来越高,而precision整体上会呈下降趋势。把recall当成横坐标,precision当成纵坐标,即可得到常用的precision-recall曲线。precision-recall曲线如下:
接下来说说AP的计算,此处参考的是PASCAL VOC challenge 的计算方法。首先设定一组阈值,[0, 0.1, 0.2, …, 1]。然后对于recall大于每一个阈值(比如recall>0.3),我们都会得到一个对应的最大precision。这样,我们就计算出了11个precision。AP即为这11个precision的平均值。这种方法英文叫做11-point interpolated average precision(差值平均精度)。具体流程为:
- 对于类别C,首先将算法输出的所有C类别的预测框,按置信度排序;
- 设定不同的k值,选择top k个预测框,计算FP和TP,使得 recall 分别等于0,0.1,0.2,0.3,0.4,0.5,0.6,0.7,0.8,0.9,1.0;
计算Precision; - 将得到的11个Precision取平均,即得到AP;
AP是针对单一类别的,mAP是将所有类别的AP求和,再取平均:
mAP = 所有类别的AP之和 / 类别的总个数
PASCAL VOC challenge 自2010年后换了另一种计算方法,提高了计算的精度,能更好地区分低准确率的方法。新的计算方法假设这N个样本中有M个正例,那么我们会得到M个recall值,对于每个recall值r,我们可以计算出对应(r' > r)的最大precision,然后对这M个precision值取平均即得到最后的AP值。参考voc2012/devkit_doc.
改进后曲线单调递减:
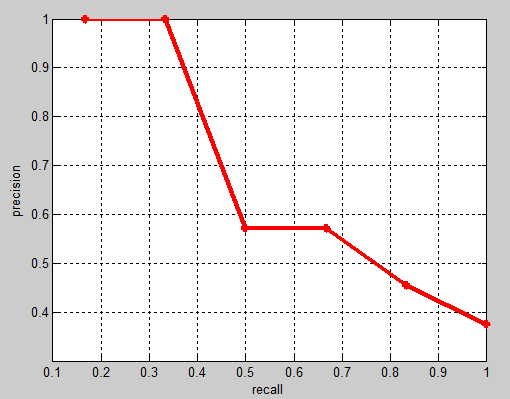
改进后的 mAP 值通常比 VOC07 的方法得到的 mAP 高一些(一般5%以内), 但也存在变低的情况。因为计算的是曲线下的面积,有时也写作ap_auc。可参考下文的代码进行理解。
AP衡量的是学出来的模型在每个类别上的好坏,mAP是取所有类别AP的平均值,衡量的是在所有类别上的平均好坏程度。
AP(COCO)[3]
在 MSCOCO 竞赛中\(AP^{50}\)或者AP@0.5指的是当设置IoU为0.5时的平均准确率。\(AP^{75}\) 是严格模式的测量. \(AP^\rm{small},AP^\rm{medium},AP^\rm{large}\) 分别对应面积 \(area <32^2,32^2 < area < 96^2,area > 96^2\) 的目标分别测试的值.
mAP@[.5:.95]是在不同 IoU (从 0.5 到 0.95, 步长0.05) 设置下的平均值,又可写作mmAP或 AP, 参考cocoeval.py.
mAP 代码参考
VOC 目标检测评估函数
function [rec,prec,ap] = VOCevaldet(VOCopts,id,cls,draw)

% npos 为ground truth objects的数目, 计算中会忽略difficult的样本
% sort detections by decreasing confidence
[sc,si]=sort(-confidence);   %按照score降序排序
ids=ids(si);
BB=BB(:,si);

% assign detections to ground truth objects
nd=length(confidence);
tp=zeros(nd,1);
fp=zeros(nd,1);
tic;
for d=1:nd
    % find ground truth image
    i=strmatch(ids{d},gtids,'exact');
    if isempty(i)
        error('unrecognized image "%s"',ids{d});
    elseif length(i)>1
        error('multiple image "%s"',ids{d});
    end

    % assign detection to ground truth object if any
    bb=BB(:,d);
    ovmax=-inf;
    for j=1:size(gt(i).BB,2)
        bbgt=gt(i).BB(:,j);
        bi=[max(bb(1),bbgt(1)) ; max(bb(2),bbgt(2)) ; min(bb(3),bbgt(3)) ; min(bb(4),bbgt(4))];
        iw=bi(3)-bi(1)+1;
        ih=bi(4)-bi(2)+1;
        if iw>0 & ih>0
            % compute overlap as area of intersection / area of union
            ua=(bb(3)-bb(1)+1)*(bb(4)-bb(2)+1) + (bbgt(3)-bbgt(1)+1)*(bbgt(4)-bbgt(2)+1) - iw*ih;
            ov=iw*ih/ua;
            if ov>ovmax
                ovmax=ov;
                jmax=j;
            end
        end
    end
    % assign detection as true positive/don't care/false positive
    if ovmax>=VOCopts.minoverlap
        if ~gt(i).diff(jmax)
            if ~gt(i).det(jmax)
                tp(d)=1;            % true positive
                gt(i).det(jmax)=true;
            else
                fp(d)=1;            % false positive (multiple detection)   % 若多个目标框对应同一个gt,则将后续(低score的)目标设为FP
            end
        end
    else
        fp(d)=1;                    % false positive
    end
end

% 由于目标框按score排序,设置不同的score阈值可以得到不同的P/R, 因此可以通过累加操作计算
fp=cumsum(fp);
tp=cumsum(tp);
rec=tp/npos;
prec=tp./(fp+tp);

% VOC2007: compute 11 point average precision
ap=0;
for t=0:0.1:1
    p=max(prec(rec>=t));
    if isempty(p)
        p=0;
    end
    ap=ap+p/11;
end

% VOC2012:
ap_new = VOCap(rec,prec);

% VOCap计算方式如下:
function ap = VOCap(rec,prec)

mrec=[0 ; rec ; 1]; % 在召回率列表首尾添加两个值
mpre=[0 ; prec ; 0];
for i=numel(mpre)-1:-1:1
    mpre(i)=max(mpre(i),mpre(i+1)); % 使mpre单调递减
end
i=find(mrec(2:end)~=mrec(1:end-1))+1; % 找出召回率产生变化的下标
ap=sum((mrec(i)-mrec(i-1)).*mpre(i)); % 计算ROC曲线下面积
重叠度(IoU,Intersect over Union):
因为我们算法不可能百分百跟人工标注的数据完全匹配,因此就存在一个对于bounding box的定位精度评价公式:IoU。 它定义了两个bounding box的重叠度,如下图所示
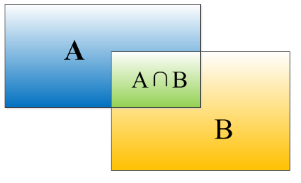
IoU就是矩形框A、B的重叠面积占A、B并集的面积比例(\(A\bigcap B\over A\bigcup B\))。
这与Jaccard相似度定义类似: \(J(A,B)={|A\cap B| \over |A\cup B|}\)
通常我们认为:
• Correct: 类别正确 且 IoU > .5
• Localization: 类别正确, .1 < IoU < .5
• Similar: 类别近似, IoU > .1
• Other: 类别错误, IoU > .1
• Background: IoU < .1 的任意目标
python代码实现
# Calculate Intersect over usion between boxes b1 and b2, here each box is defined with 2 points
# box(startX, startY, endX, endY), there are other definitions ie box(x,y,width,height)
def calc_iou(b1, b2):
 # determine the (x, y)-coordinates of the intersection rectangle
 xA = max(b1[0], b2[0])
 yA = max(b1[1], b2[1])
 xB = min(b1[2], b2[2])
 yB = min(b1[3], b2[3])

 # compute the area of intersection rectangle
 area_intersect = (xB - xA + 1) * (yB - yA + 1)

 # Calculate area of boxes
 area_b1 = (b1[2] - b1[0] + 1) * (b1[3] - b1[1] + 1)
 area_b2 = (b2[2] - b2[0] + 1) * (b2[3] - b2[1] + 1)

 # compute the intersection over union by taking the intersection
 # area and dividing it by the sum of prediction + ground-truth
 # areas - the intersection area
 iou = area_intersect / float(area_b1 + area_b2 - area_intersect)

 # return the intersection over union value
 return iou

# IoU 实现 numpy 方式
import numpy as np

def calc_iou_np(xy_min1, xy_max1, xy_min2, xy_max2):
    # Get areas
    areas_1 = np.multiply.reduce(xy_max1 - xy_min1)
    areas_2 = np.multiply.reduce(xy_max2 - xy_min2)

    # determine the (x, y)-coordinates of the intersection rectangle
    _xy_min = np.maximum(xy_min1, xy_min2)
    _xy_max = np.minimum(xy_max1, xy_max2)
    _wh = np.maximum(_xy_max - _xy_min, 0)

    # compute the area of intersection rectangle
    _areas = np.multiply.reduce(_wh)

    # return the intersection over union value
    return _areas / np.maximum(areas_1 + areas_2 - _areas, 1e-10)

 浙公网安备 33010602011771号
