监控-Prometheus03-Exporter
- 在Prometheus核心组件中,Exporter是重要的组成部分,在实际中监控样本数据的收集都是由Exporter完成的,Prometheus服务器只需要定时从这些Exporter提供的HTTP服务获取监控数据即可。
1、Exporter概述
- Exporter本质上是将收集的数据转化为对应的文本格式,并提供HTTP接口,供Prometheus定期采集数据。
1.1、Exporter类型
- 一般可以将Exporter分为两类:
- 直接采集型。应用程序中直接内置了相应的类似于Exporter的功能,用于向Prometheus直接提供Target数据支持。这样设计的好处是,可以更好地监控各自系统的内部运行状态,同时也适合更多自定义监控指标的项目实施。例如cAdvisor、Kubernetes等,它们均内置了用于向Prometheus提供监控数据的端点。
- 间接采集型。原始监控目标并不直接支持Prometheus,需要使用Prometheus提供的Client Library编写该监控目标的监控采集程序,用户可以将该程序独立运行,去获取指定的各类监控数据值。例如,由于Linux操作系统自身并不能直接支持Prometheus,用户无法从操作系统层面上直接提供对Prometheus的支持,因此单独提供Node exporter。
1.2、文本数据格式
- 在Prometheus监控环境中,所有返回监控样本数据的Exporter程序,均需要遵守Prometheus规范,即基于文本的数据格式,其特点是具有更好地跨平台和可读性。
- 除了当前基于文本的数据格式之外,早期版本的Prometheus还支持基于Protocol Buffers(又名Protobuf)的展示格式。但是,从版本2.0开始,Prometheus不再支持基于Protobuf的格式。Prometheus的所有流程都需要使用基于文本的格式。
- 可以从Prometheus Web UI提供的页面http://10.1.1.11:9090/metrics来获取信息:
- Exporter收集的数据值转化成文本内容。
# HELP go_gc_duration_seconds A summary of the pause duration of garbage collection cycles.
# TYPE go_gc_duration_seconds summary
go_gc_duration_seconds{quantile="0"} 2.4516e-05
go_gc_duration_seconds{quantile="0.25"} 6.2323e-05
go_gc_duration_seconds{quantile="0.5"} 9.2648e-05
go_gc_duration_seconds{quantile="0.75"} 0.000123879
go_gc_duration_seconds{quantile="1"} 0.000708196
go_gc_duration_seconds_sum 0.014005052
go_gc_duration_seconds_count 135
# HELP prometheus_engine_query_duration_seconds Query timings
# TYPE prometheus_engine_query_duration_seconds summary
prometheus_engine_query_duration_seconds{slice="inner_eval",quantile="0.5"} NaN
...
- Prometheus基于文本的格式是面向行的。行由换行符(\n)分隔,最后一行必须以换行符结尾,空行被忽略,以#开始的行通常都是注释内容:
- 以#HELP开始的行,表示metric的帮助与说明注释,可以包含当前监控指标名称和对应的说明信息。
- 以#TYPE开始的行,表示定义metric类型,可以包含当前监控指标名称和类型,类型有Counter、Gauge、Histogram、Summary和Untyped。
- 以非#开始的行,即监控样本数据。
- 其他一般性注释,方便阅读使用,会被Prometheus忽略。
- 每行标签的格式:
metric_name{label_name1=label_value1, label_name2=label_value2, ...} value [timestamp]
-
- metric_name和label_name这些名称遵循PromQL格式规范要求。
- label_value可以是任何UTF-8字符序列,但反斜杠\、双引号和换行符(\n))必须分别转义为\\、\''和\n,其值必须使用双引号""引起来。
- value是Go的ParseFloat()函数所需的浮点数。除标准数值外,Nan、+Inf和-Inf分别代表数字、正无穷大和负无穷大的有效值。
- timestamp(时间戳)是int64(自纪元以来的毫秒,即1970-01-01 00:00:00 UTC,不包括闰秒)。
- 对于具有相同metric_name名称的样本数据,我们必须按照一个组的特定顺序依次排列,当然可选的#HELP和#TYPE行没有特定的顺序。这样就要求每行的监控指标名称和标签必须进行唯一组合,否则,会出现未定义行为。
- 由于指标的Histogram和Summary类型很难用文本格式表示,因此需要特别注意的是,如果某样本数据metric叫作x,且它的类型正好是Histogram或Summary时,必须满足以下适用约定:
- 样本数据的总和应表示为x_sum。
- 样本数据的总量应表示为x_count。
- Summary类型的样本数据的quantile应表示为x{quantile="y"}。
- Histogram类型的样本分区统计数据应表示为x_bucket{le="y"}。
- Histogram类型的样本必须包含x_bucket{le="+Inf"},它的值等于x_count的值。
- Summary和Historam中quantile和le必须按由小到大的顺序进行排列。
1.3、获取Exporter
- Prometheus Exporter社区很活跃,提供了支持120+常见开源组件的Exporter,一些比较有名的技术厂商都专门编写对应的Prometheus Exporter,例如,Oracle编写的Weblogic Exporter,IBM编写的IBM MQ exporter,Kubernetes、etcd都直接内置了基于Exporter规范的Metrics。
- 从Prometheus官网获取Exporter
- https://prometheus.io/docs/instrumenting/exporters/
- 从GitHub官网获取Exporter
- https://github.com/prometheus
- 常用的exporter:
- 白盒监控:Node exporter、wmi_exporter、mysqld_exporter、redis_exporter、nginx-vts-exporter
- 黑盒监控:blackbox_exporter
2、主机监控(node_exporter)
- 对于主机中各项性能指标的监控,不同的内核会展示不同的监控指标(metric),例如Linux和FreeBSD均使用各自的方法。随着技术的发展以及各类监控指标的变化,使得各种主机监控使用的Exporter可能进行重构。
- 由于Linux操作系统自身并不直接支持Prometheus,所以Prometheus官方提供了Go语言编写的Node exporter来实现对Linux操作系统主机的监控数据采集。它提供了系统内几乎所有的标准指标,如CPU、内存、磁盘空间、磁盘I/O、系统负载和网络带宽。另外,它还提供了由内核公开的大量额外监控指标,从负载平均到主板温度等。
2.1、安装并启动node_exporter
1、部署环境
- 软件版本
- https://github.com/prometheus/node_exporter/releases/download/v1.3.0/node_exporter-1.3.0.linux-amd64.tar.gz
- 系统环境
- 10.1.1.11:CentOSLinuxrelease7.7.1908(Core)
2、安装node_exporter
]# mkdir /apps/
]# tar zvfx node_exporter-1.3.0.linux-amd64.tar.gz -C /apps/
]# ln -s /apps/node_exporter-1.3.0.linux-amd64/ /apps/node_exporter

]# chown -R root:root /apps/node_exporter/
3、配置unit文件
]# vim /usr/lib/systemd/system/node_exporter.service
[Unit]
Description=node_exporter
After=network.target
[Service]
Type=simple
User=root
Group=root
ExecStart=/apps/node_exporter/node_exporter --web.listen-address=:9100
Restart=on-failure
[Install]
WantedBy=multi-user.target
4、启动node_exporter
//通知systemd重新加载配置文件
]# systemctl daemon-reload

]# systemctl enable node_exporter.service
]# systemctl start node_exporter.service

]# systemctl status node_exporter.service
2.2、与Prometheus集成
- 当启动node_exporter后,node_exporter和Prometheus还没有进行对接关联,此时,二者只是各自独立运行的应用程序。现在需要将已安装部署好的node_exporter添加到Prometheus服务器中。可以在Prometheus主机目录中,找到主配置文件,使用其中的静态配置功能static_configs来采集node_exporter提供的数据。
1、修改Prometheus.yml文件
global:
  scrape_interval: 15s
  evaluation_interval: 15s

alerting:
  alertmanagers:
  - static_configs:
    - targets:

rule_files:

scrape_configs:
- job_name: "prometheus"
  static_configs:
  - targets: ["localhost:9090"]
#添加一个job
- job_name: "node_exporter"
  static_configs:
  - targets: ["10.1.1.13:9100"]
2、重新加载prometheus.yml文件
//通过发送SIGHUP信号,重新加载配置文件但不停止服务
]# kill -HUP PID
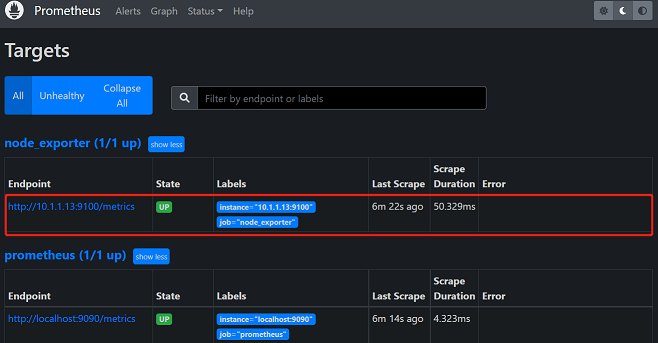
3、在浏览器中查看target
- 在http://10.1.1.11:9090/targets页面中查看target。
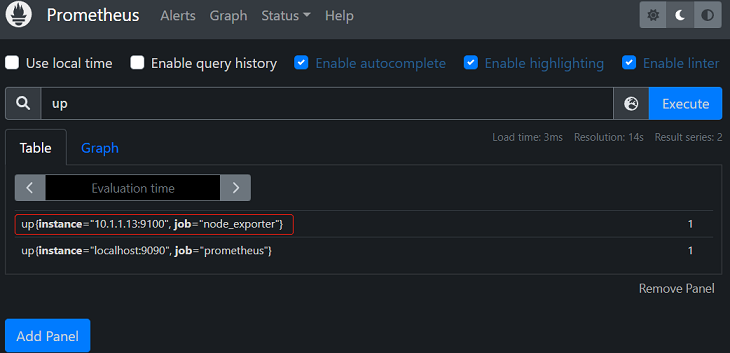
- 在http://10.1.1.11:9090/graph页面的搜索框中输入“up”进行搜索,可以获得被监控的主机。
2.3、查看metrics
- 在http://10.1.1.13:9100/metrics页面中,可以直接查看当前被监控主机的样本信息
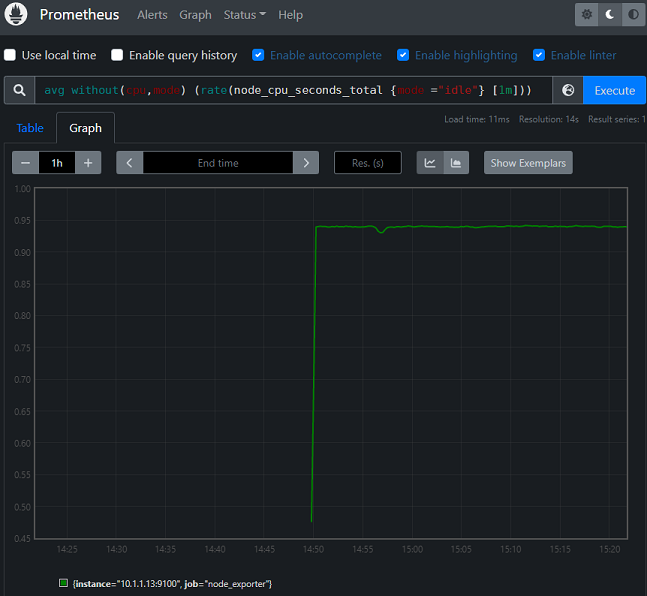
1、CPU数据采集
- 对CPU数据进行采集的主要监控指标是node_cpu_seconds_total。
- node_cpu_seconds_total是一个计数器,即此类metric是Counter类型,用来标识每核CPU各个模式下占用的时间。它的标签(Label)是cpu和mode。
- 对每核CPU来说,mode将以1秒级的速度增长。可以使用以下PromQL表达式进行查询:
- avg without(cpu,mode) (rate(node_cpu_seconds_total {mode ="idle"} [1m]))
2、内存信息采集
- 使用系统命令查看当前系统的内存使用情况
]# free -b
              total        used        free      shared  buff/cache   available
Mem:     1907814400   702844928    99368960    29761536  1105600512   983306240
Swap:             0           0           0
- 通过访问http://10.1.1.13:9100/metrics界面,找到与采集总计物理内存大小相关的metric。
- 和使用Linux命令查看到的total数值一样。
# HELP node_memory_MemTotal_bytes Memory information field MemTotal_bytes.
# TYPE node_memory_MemTotal_bytes gauge
node_memory_MemTotal_bytes 1.9078144e+09
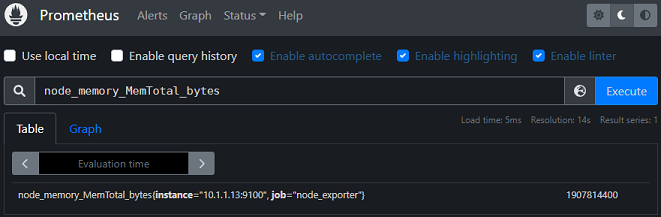
- 在Prometheus Web UI中的Graph页面中查询到node_memory_MemTotal_bytes信息。
- 经常使用的内存指标有:node_memory_MemAvailable_bytes、node_memory_MemFree_bytes、node_memory_SwapFree_bytes等。
1
# #

 浙公网安备 33010602011771号