Echarts 数据可视化 (三)
折线图
图表图标样式
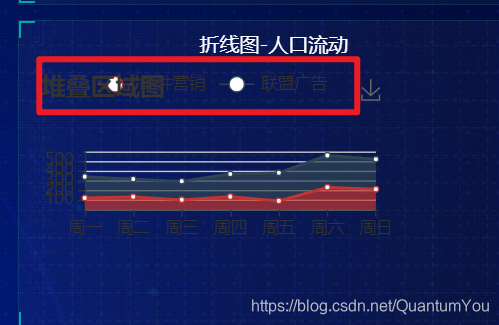
原先样式

代码:

  legend: {
      top : "0%" ,
      data: ['邮件营销', '联盟广告'] ,
      textStyle :{
        color : "rgba(255,255,255,.5)" ,
        fontSize : "12"
      }
    }
修改后样式

X轴文本,线 颜色

代码:
xAxis: [
      {
        type: 'category',
        boundaryGap: false,
        data: ['周一', '周二', '周三', '周四',
          '周五', '周六', '周日'] ,
        axisLabel : {
          textStyle : {
            // 设置文本颜色
            color : "rgba(255,255,255,.6)" ,
            fontSize : 12
          }
        } ,
        axisLine : {
          lineStyle : {
            // 设置 x轴线颜色
            color : "rgba(255,255,255,.6)" ,
          }

        }
      }
    ],

折线线条样式

颜色渐变

areaStyle: {
          //  渐变色设置
          normal:{
            //颜色渐变函数 前四个参数分别表示四个位置依次为左、下、右、上
            color: new echarts.graphic.LinearGradient(0, 0, 0, 1, [{

              offset: 0,
              color: 'rgba(255,0,255,0.69)'
            }, {
              offset: .34,
              color: 'rgba(156,15,25,0.45)'
            },{
              offset: 1,
              color: 'rgba(0,255,254,0.40)'
            }])

          }
        } ,

折线拐点
折线拐点大小设置

参数在 series 内

        symbol : "circle" ,
        //  拐点大小
        symbolSize : 12 ,
        showSymbol : false ,
        itemStyle : {
          color : "#0184d5" ,
          borderColor : "rgba(211,220,107,.1)" ,
          borderWidth : 12
        } ,
showSymbole : false , 默认不显示拐点,经过显示
饼状图
半径
seies 参数 中
radius: ['40%', '70%'],

标签
label 图标上的文字

南丁格尔玫瑰图
引入界面后修改位置


代码
    {
        name: '面积模式',
        type: 'pie',
        radius: [10, 50],
        center: ['50%', '50%'],
        roseType: 'area',
        itemStyle: {
          borderRadius: 5
        },

样式 —— 面积 / 半径模式

半径模式 roseType : ' radius' ,
图列导引线
LabelLine 属性下
   // length 连接图形线条
       length : 6 ,
      // length  连接文字线条
       length2 : 8

后期优化&Echart社区
约束屏幕尺寸
/* 约束屏幕尺寸 */
@media screen and (max-width: 1024px) {
  html {
    font-size: 42px !important;
  }
}
@media screen and (min-width: 1920) {
  html {
    font-size: 80px !important;
  }
}
社区
开发模板参考


 浙公网安备 33010602011771号