import numpy as np
ls1 = [10, 42, 0, -17, 30]
nd1 =np.array(ls1)
print(nd1)
print(type(nd1))
import scipy
import numpy as np
from scipy import linalg
mat_ = np.array([[2,3,1],[4,9,10],[10,5,6]]) #创建矩阵
print(mat_)
#>[[ 2 3 1],[ 4 9 10],[10 5 6]]
linalg.det(mat_) #矩阵的行列式
inv_mat = linalg.inv(mat_) #矩阵的逆
print(inv_mat)
#>[[ 0.02409639 -0.07831325 0.12650602]
#[ 0.45783133 0.01204819 -0.09638554]
#[-0.42168675 0.12048193 0.03614458]]
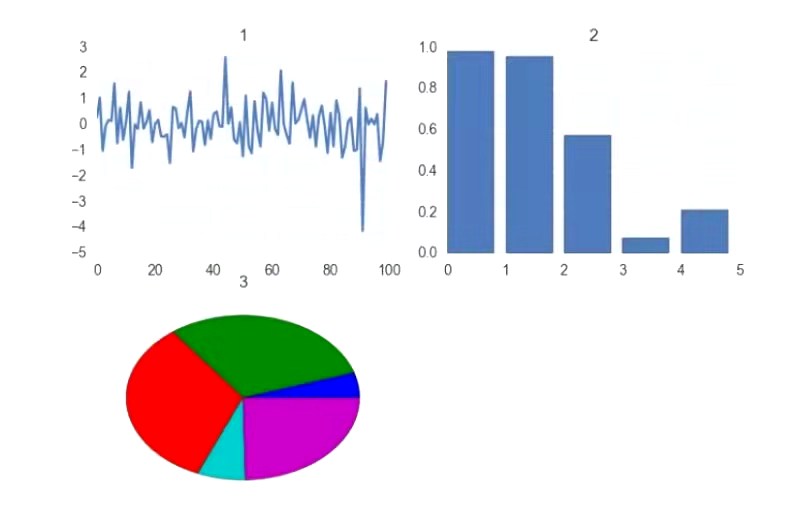
fig = plt.figure()
ax = fig.add_subplot(2, 2, 1)
y = np.random.randn(100)
plt.plot(y);
ax.set_title('1')
y = np.random.rand(5)
x = np.arange(5)
ax = fig.add_subplot(2, 2, 2)
plt.bar(x, y)
ax.set_title('2');
y = np.random.rand(5)
y = y / np.sum(y)
y[y < .05] = .05
ax = fig.add_subplot(2, 2, 3)
plt.pie(y)
ax.set_title('3')
plt.draw()
plt.show()
![]()


 浙公网安备 33010602011771号