Py4j的简单使用
一、
Py4j官网:https://www.py4j.org/,介绍大家可以到官网进行了解。
二、
本次介绍的是通过java调用python的函数,以及python的返回值给到java。
三、
演示:
java代码
import py4j.GatewayServer;

import java.net.InetAddress;

public class ExampleClientApplication {

    public static void main(String[] args) throws Exception{
        for(int i =0;i<3;i++) {
            GatewayServer.turnLoggingOff();
            GatewayServer.GatewayServerBuilder builder = new GatewayServer.GatewayServerBuilder();
            GatewayServer server = builder.javaAddress(InetAddress.getByName("10.252.218.147")).build();
//            GatewayServer server = new GatewayServer();
            server.start();
            IHello hello = (IHello) server.getPythonServerEntryPoint(new Class[] { IHello.class });
            try {
//            System.out.println(hello.sayHello());
//            System.out.println(hello.sayHello(2, "Hello World", "/Users/admin/Downloads/临时文件/pycharmProject/标签分析_0_2023-04-24+18_32_16.xlsx"));
//                System.out.println(hello.sayHello());
                System.out.println(hello.sayHello2("a", "b", "c"));
            } catch (Exception e) {
                e.printStackTrace();
            }
            server.shutdown();
            Thread.sleep(1000L);
        }

    }
}
public interface IHello {
    public String sayHello();

    public String sayHello(int i, String s, String path);

    public String sayHello2(String s1, String s2, String s3);
}
其中:IHello是一个java的接口,调用的是sayHello方法(带3个参数),实质调用的是python侧的该函数,java没有写其实现类。
python代码
from sklearn.tree import DecisionTreeClassifier, plot_tree
from sklearn.metrics import confusion_matrix, accuracy_score, recall_score, precision_score, f1_score
import matplotlib.pyplot as plt
import numpy as np
from sklearn.datasets import load_iris
import pandas as pd
import json
from sklearn import tree
import graphviz
import pydotplus
import matplotlib

matplotlib.use('agg')


class SimpleHello(object):


    def sayHello2(self, s1, s2, s3):
        return s1 + '_' + s2 + '_' + s3

    def sayHello(self, int_value=None, string_value=None, path=None):
        # print(int_value, string_value)
        # return "Said hello to {0}".format(string_value)

        # Load the iris dataset
        # X = np.array([[0, 0], [0, 1], [1, 0], [1, 1]])
        # y = np.array([0, 1, 1, 0])
        m = {}
        # iris = load_iris()
        # X = iris.data
        # y = iris.target

        # df = pd.read_excel("/Users/admin/Downloads/临时文件/pycharmProject/标签分析_0_2023-04-24+18_32_16.xlsx")
        df = pd.read_excel(path)
        df1 = df
        df2 = df.drop(columns=['flag', 'boss_id', 'ds'])
        X = np.array(df2)
        # print(X)
        y = np.array(df['flag'])
        # print(y)

        # Train the decision tree model
        dt = DecisionTreeClassifier(max_depth=4, min_samples_leaf=1, criterion='entropy')
        dt.fit(X, y)

        # Calculate feature importance
        importance = dt.feature_importances_
        print("Feature Importance:", importance)
        m['Importance'] = importance.tolist()
        print(type(importance))

        # Make predictions on the test data
        y_pred = dt.predict(X)

        # Calculate confusion matrix
        cm = confusion_matrix(y, y_pred)
        print(type(cm))
        print("Confusion Matrix:\n", cm)
        m["matrix"] = cm.tolist()

        # Calculate accuracy
        accuracy = accuracy_score(y, y_pred)
        print("Accuracy:", accuracy)
        m["Accuracy"] = accuracy

        # Calculate recall
        recall = recall_score(y, y_pred, average="macro")
        print("Recall:", recall)
        m["Recall"] = recall

        # Calculate precision
        precision = precision_score(y, y_pred, average="macro")
        print("Precision:", precision)
        m["Precision"] = precision

        # Calculate F1 score
        f1 = f1_score(y, y_pred, average="macro")
        print("F1 Score:", f1)
        m["F"] = f1

        # Plot the decision tree and save it
        # plt.figure(figsize=(10, 8))
        # mpl.rcParams['axes.unicode_minus'] = False
        plt.rcParams['font.sans-serif'] = ['SimHei']
        # print(iris.feature_names)
        # print(type(iris.feature_names))
        # print(iris.target_names)
        # print(type(iris.target_names))

        # plot_tree(dt, filled=True, feature_names=np.array(df1.columns), class_names=np.array(['1', '0']))
        # plt.savefig("./decision_tree1.png", dpi=300)

        with open("./model.dot", 'w') as f:
            f = tree.export_graphviz(dt, out_file=f)

        #     # 画图,保存到pdf文件
        #     # 设置图像参数
        dot_data = tree.export_graphviz(dt, out_file=None,
                                        feature_names=np.array(df2.columns),
                                        filled=True, rounded=True,
                                        special_characters=True)
        dot_data = dot_data.replace("helvetica", "MicrosoftYaHei")
        graph = pydotplus.graph_from_dot_data(dot_data)
        #     # 保存图像到pdf文件
        # graph.write_pdf("./model_4.pdf")
        graph.write_svg("./model_5.svg")

        return json.dumps(m)

    class Java:
        implements = ["org.example.java_call_python.IHello"]


# Make sure that the python code is started first.
# Then execute: java -cp py4j.jar py4j.examples.SingleThreadClientApplication
from py4j.java_gateway import JavaGateway, CallbackServerParameters, GatewayParameters
#
simple_hello = SimpleHello()
gateway_param = GatewayParameters(address="10.252.218.147")
gateway = JavaGateway(
    gateway_parameters=gateway_param,
    callback_server_parameters=CallbackServerParameters(),
    python_server_entry_point=simple_hello)
使用方式:先执行python程序,在运行java程序,二者通过GatewayServer进行通信。
效果展示:
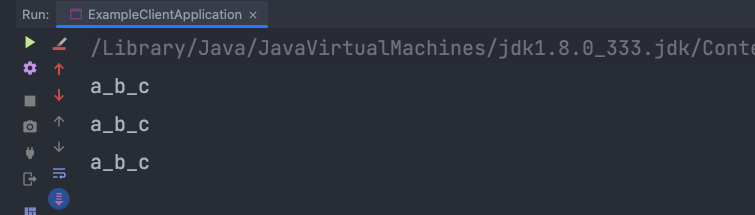
这样就达到了在java调用python的函数进行返回,博主的场景是在java中调用python的决策树算法,大家可以自行进行函数内部逻辑封装即可。