SQLSERVER最普通的等待类型排行榜
SQLSERVER最普通的等待类型排行榜
http://www.sqlskills.com/blogs/paul/common-wait-stats-24-hours/
Back in February I kicked off a survey asking you to run code that created a 24-hour snapshot of the most prevalent wait statistics. It’s taken me a few months to provide detailed feedback to everyone who responded and to correlate all the information together. Thanks to everyone who responded!
I did this survey because I wanted to see how the results had changed since my initial wait statistics survey back in 2010.
The results are interesting!
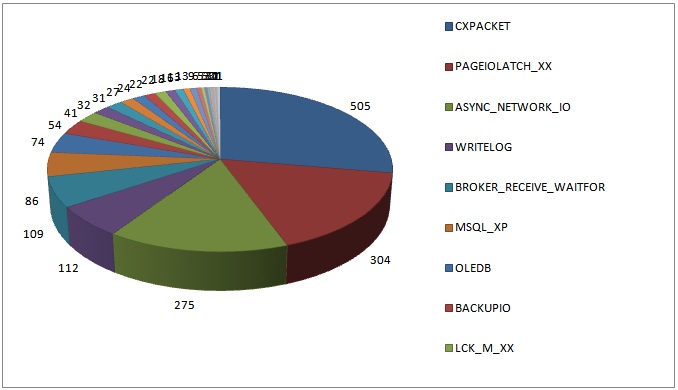
2010 Survey Results
Results from 1823 servers, top wait type since server last restarted (or waits cleared). The blog post for this survey (Wait statistics, or please tell me where it hurts) has a ton of information about what these common wait types mean, and I’m not going to repeat all that in this blog post.

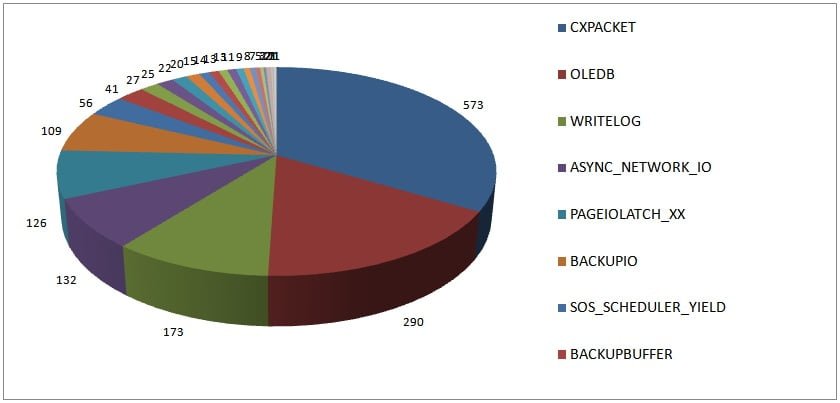
2014 Survey Results
Results from 1708 servers, top wait type over 24 hours
The distribution of the top waits has changed significantly over the last four years, even when taking into account that in the 2010 survey I didn’t filter outBROKER_RECEIVE_WAITFOR.
- CXPACKET is still the top wait type, which is unsurprising
- OLEDB has increased to being the top wait type roughly 17% of the time compared to roughly 4% in 2010
- WRITELOG has increased to being the top wait 10% of the time compared with 6% in 2010
- ASYNC_NETWORK_IO has decreased to being the top wait 8% of the time compared with 15% in 2010
- PAGEIOLATCH_XX has decreased to being the top wait 7% of the time compared with 18% in 2010
These percentages remain the same even when I ignore the BROKER_RECEIVE_WAITFOR waits in the 2010 results.
Now I’m going to speculate as to what could have caused the change in results. I have no evidence that supports most of what I’m saying below, just gut feel and supposition – you might disagree. Also, even though the people reading my blog and responding to my surveys are likely to be paying more attention to performance and performance tuning than the general population of people managing SQL Server instances across the world, I think that these results are representative of what’s happening on SQL Server instances across the world.
I think that OLEDB waits have increased in general due to more and more people using 3rd-party performance monitoring tools that make extensive, repeated use of DMVs. Most DMVs are implemented as OLE-DB rowsets and will cause many tiny OLEDB waits (1-2 milliseconds on average, or smaller). This hypothesis is actually borne out by the data I received and confirmation from many people who received my detailed analyses of results they sent me. If you see hundreds of millions or billions of tiny OLEDB waits, this is likely the cause.
I think WRITELOG waits being the top wait have increased partly because other bottlenecks have become less prevalent, and so the next highest bottleneck is the transaction log, and partly because more workloads are hitting logging bottlenecks inside SQL Server that are alleviated starting in SQL Server 2012 (blog post coming next week!). I also think that WRITELOG waits have been prevented from becoming even more prevalent because of the increased use of solid-state disks for transaction log storage mitigating the increased logging from higher workloads.
Now it could be that the drop in PAGEIOLATCH_XX and ASYNC_NETWORK_IO waits being the top wait is just an effect caused by the increase in OLEDB and WRITELOG waits. It could also be because of environmental changes…
PAGEIOLATCH_XX waits being the top wait might have decreased because of:
- Increased memory on servers meaning that buffer pools are larger and more of the workload fits in memory, so fewer read I/Os are necessary.
- Increased usage of solid-state disks meaning that individual I/Os are faster, so when I/Os do occur, the PAGEIOLATCH_XX wait time is smaller and so the aggregate wait time is smaller and it is no longer the top wait.
- More attention being paid to indexing strategies and buffer pool usage.
ASYNC_NETWORK_IO waits being the top wait might have decreased because of fewer poorly written applications, or fixes to applications that previously were poorly written. This supposition is the most tenuous of the four and I really have no evidence for this at all. I suspect it’s more likely the change is an effect of the changes in prevalence of the other wait types discussed above.
Summary
I think it’s interesting how the distribution of top waits has occurred over the last four years and I hope my speculation above rings true with many of you. I’d love to hear your thoughts on all of this in the post comments.
It’s not necessarily bad to have any particular wait type as the most prevalent one in your environment, as waits always happen, so there has to be *something* that’s the top wait on your system. What’s useful though is to trend your wait statistics over time and notice how code/workload/server/schema changes are reflected in the distribution of wait statistics.
There is lots of information about wait statistics in my Wait Statistics blog category and there’s a new whitepaper (SQL Server Performance Tuning Using Wait Statistics: A Beginners Guide) on wait statistics written by Jonathan and Erin in conjunction with Red Gate which you can download from our website here.
Enjoy!


【推荐】编程新体验,更懂你的AI,立即体验豆包MarsCode编程助手
【推荐】凌霞软件回馈社区,博客园 & 1Panel & Halo 联合会员上线
【推荐】抖音旗下AI助手豆包,你的智能百科全书,全免费不限次数
【推荐】博客园社区专享云产品让利特惠,阿里云新客6.5折上折
【推荐】轻量又高性能的 SSH 工具 IShell:AI 加持,快人一步
· 浏览器原生「磁吸」效果!Anchor Positioning 锚点定位神器解析
· 没有源码,如何修改代码逻辑?
· 一个奇形怪状的面试题:Bean中的CHM要不要加volatile?
· [.NET]调用本地 Deepseek 模型
· 一个费力不讨好的项目,让我损失了近一半的绩效!
· 微软正式发布.NET 10 Preview 1:开启下一代开发框架新篇章
· 没有源码,如何修改代码逻辑?
· PowerShell开发游戏 · 打蜜蜂
· 在鹅厂做java开发是什么体验
· WPF到Web的无缝过渡:英雄联盟客户端的OpenSilver迁移实战