16次坐标轴
import matplotlib.pyplot as plt
import numpy as np
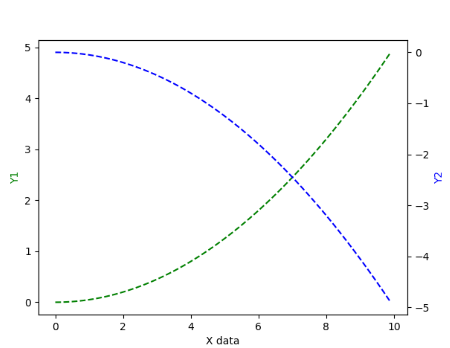
x = np.arange(0,10,0.1)
y1 = 0.05*x**2
y2 = -1*y1
fig,ax1 = plt.subplots()
ax2 = ax1.twinx()
ax1.plot(x,y1,'g--')
ax2.plot(x,y2,'b--')
ax1.set_xlabel('X data')
ax1.set_ylabel('Y1',color='g')
ax2.set_ylabel('Y2',color='b')
plt.show()

 浙公网安备 33010602011771号