
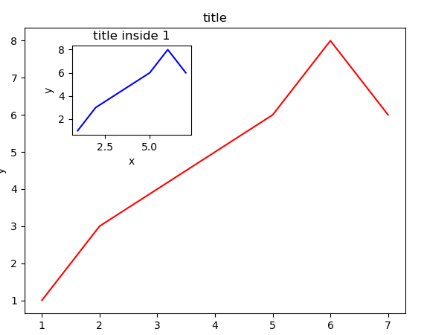
15图中图
import matplotlib.pyplot as plt
import matplotlib.gridspec as gridspec

fig = plt.figure()
x = [1,2,3,4,5,6,7]
y = [1,3,4,5,6,8,6]

left,bottom,width,height = 0.1,0.1,0.8,0.8
ax1 = fig.add_axes([left,bottom,width,height])
ax1.plot(x,y,'r')
ax1.set_xlabel('x')
ax1.set_ylabel('y')
ax1.set_title('title')


left,bottom,width,height = 0.2,0.6,0.25,0.25
ax2 = fig.add_axes([left,bottom,width,height])
ax2.plot(x,y,'b')
ax2.set_xlabel('x')
ax2.set_ylabel('y')
ax2.set_title('title inside 1')


plt.show()

 浙公网安备 33010602011771号