import matplotlib.pyplot as plt
import matplotlib.gridspec as gridspec
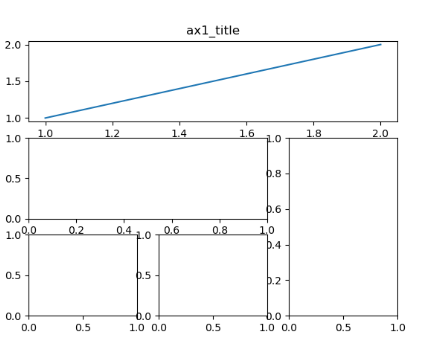
#method 1
plt.figure()
ax1 = plt.subplot2grid((3,3),(0,0),colspan=3,rowspan=1)
ax1.plot([1,2],[1,2])
ax1.set_title('ax1_title')
ax2=plt.subplot2grid((3,3),(1,0),colspan=2)
ax3=plt.subplot2grid((3,3),(1,2),rowspan=2)
ax4=plt.subplot2grid((3,3),(2,0))
ax5=plt.subplot2grid((3,3),(2,1))
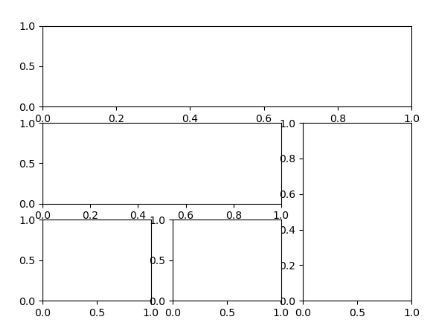
#method 2
plt.figure()
gs = gridspec.GridSpec(3,3)
ax11 = plt.subplot(gs[0,:])
ax12 = plt.subplot(gs[1,:2])
ax13 = plt.subplot(gs[1:,2])
ax14 = plt.subplot(gs[-1,0])
ax15 = plt.subplot(gs[-1,-2])
plt.show()
![image-20230131185801756]()
![image-20230131185811983]()


 浙公网安备 33010602011771号