
11Image图片
import matplotlib.pyplot as plt
import numpy as np
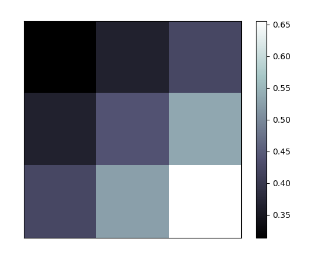
#image data
a = np.array([0.31366,0.36534,0.42373,
0.36534,0.43959,0.53444,
0.42333,0.52555,0.65566]).reshape(3,3)
plt.imshow(a,interpolation='nearest',cmap='bone',origin='upper')
plt.colorbar()
plt.xticks(())
plt.yticks(())
plt.show()

 浙公网安备 33010602011771号