import matplotlib.pyplot as plt
import numpy as np
x = np.linspace(-3,3,50)
y = 2*x+1
plt.figure()
#范围
plt.xlim((-3,4))
plt.ylim((-3,6))
#轴含义(标签)
plt.xlabel('X')
plt.ylabel('Y')
#设置坐标轴位置
#gca = 'get current axis '
ax = plt.gca()
#删除上轴和右轴
ax.spines['right'].set_color('none')
ax.spines['top'].set_color('none')
#更改下轴和左轴位置
ax.xaxis.set_ticks_position('bottom')
ax.spines['bottom'].set_position(('data',0))
ax.yaxis.set_ticks_position('left')
ax.spines['left'].set_position(('data',0))
#标注
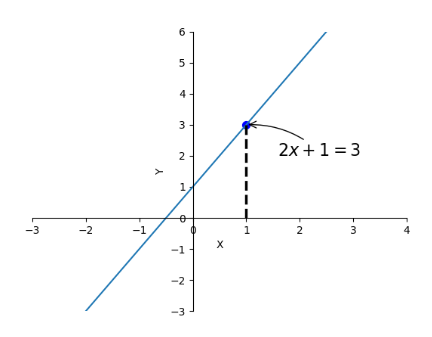
plt.plot(x,y)
x0=1
y0=2*x0+1
plt.scatter(x0,y0,s=50,color='b')
plt.plot([x0,x0],[y0,0],'k--',lw=2.5)
#method 1
plt.annotate(r'$2x+1=%s$'%y0,xy=(x0,y0),xycoords='data',xytext=(+30,-30),textcoords='offset points',
fontsize=16,arrowprops=dict(arrowstyle='->',connectionstyle='arc3,rad=.2'))
plt.show()
![image-20230131170614180]()

 浙公网安备 33010602011771号