
04设置坐标轴2
```python
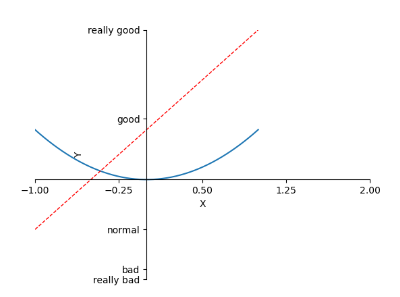
import matplotlib.pyplot as plt
import numpy as np
x = np.linspace(-1,1,50)
y1 = 2*x+1
y2 = x**2
plt.figure()
plt.plot(x,y2)
plt.plot(x,y1,color='red',linewidth=1.0,linestyle='--')
#范围
plt.xlim((-1,2))
plt.ylim((-2,3))
#轴含义(标签)
plt.xlabel('X')
plt.ylabel('Y')
#更换下标
new_ticks = np.linspace(-1,2,5)
print(new_ticks)
plt.xticks(new_ticks)
plt.yticks([-2,-1.8,-1,1.22,3],
['really bad','bad','normal','good','really good'])
#设置坐标轴位置
#gca = 'get current axis '
ax = plt.gca()
#删除上轴和右轴
ax.spines['right'].set_color('none')
ax.spines['top'].set_color('none')
#更改下轴和左轴位置
ax.xaxis.set_ticks_position('bottom')
ax.yaxis.set_ticks_position('left')
ax.spines['bottom'].set_position(('data',0))
ax.spines['left'].set_position(('data',0))
plt.show()
```

 浙公网安备 33010602011771号