
02figure图像
import matplotlib.pyplot as plt
import numpy as np
x = np.linspace(-1,1,50)
y1 = 2*x+1
y2 = x**2
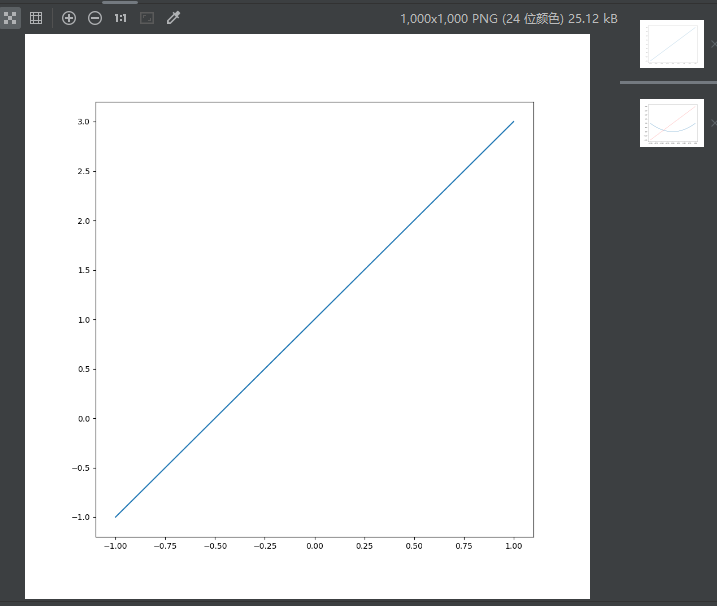
plt.figure(num=1,figsize=(10,10))
plt.plot(x,y1)
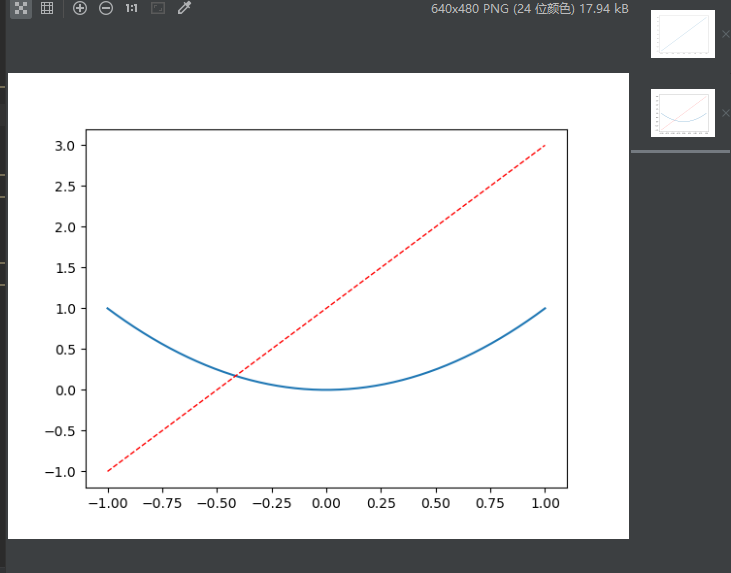
plt.figure(num=2)
plt.plot(x,y2)
plt.plot(x,y1,color='red',linewidth=1.0,linestyle='--')
plt.show()

 浙公网安备 33010602011771号