
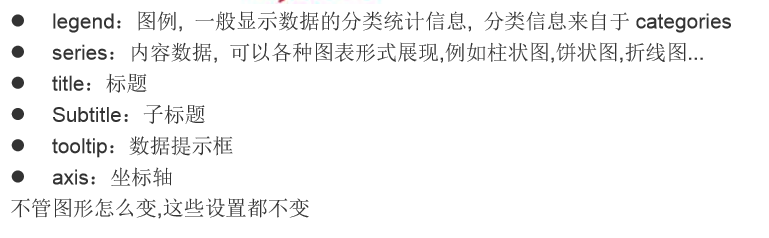
highcharts前端图表技术
前端报表技术:使用 JavaScript 生成漂亮图表
百度 echarts: http://echarts.baidu.com/examples.html
Funsioncharts : http://www.fusioncharts.com/goodies/fusioncharts-free/
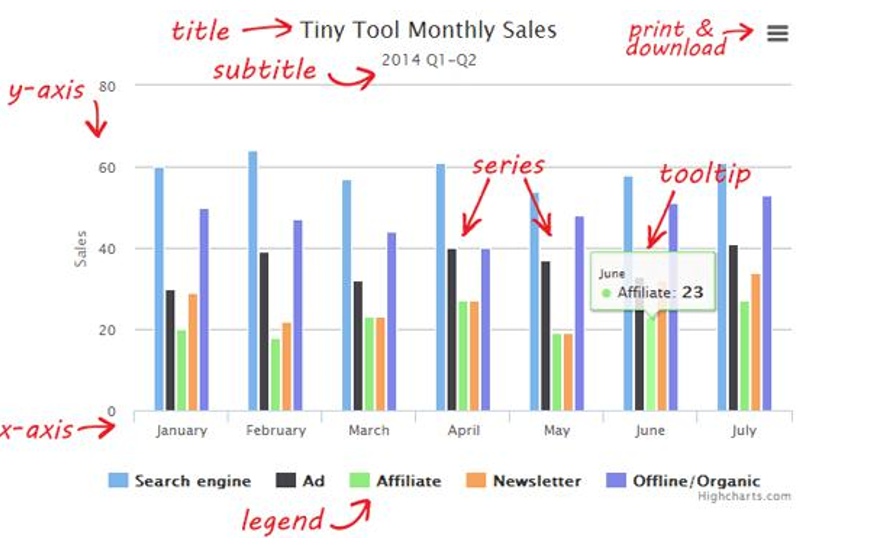
Highcharts : 折线图、 区域图、 柱状图、 饼状图 …
下载地址: http://www.highcharts.com/download
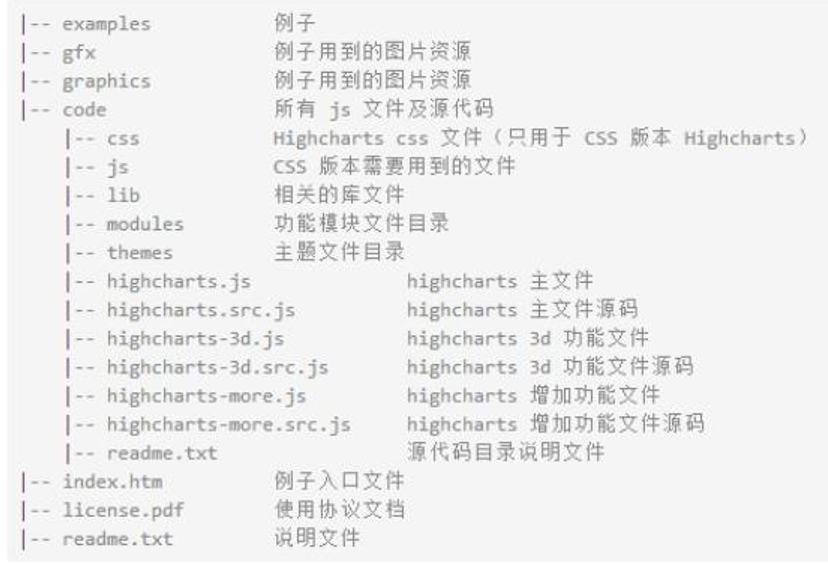
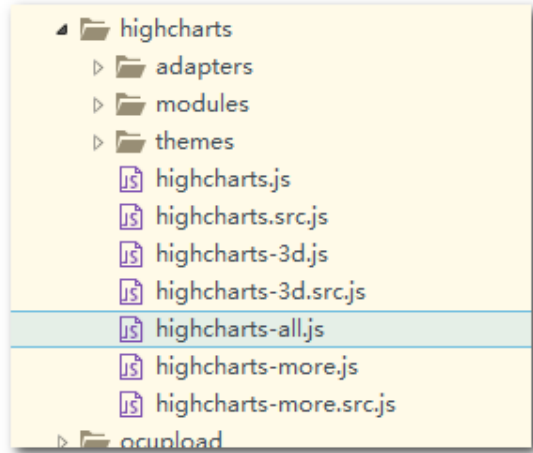
1.目录结构(不同版本结构可能有所不同)
2.搭建环境
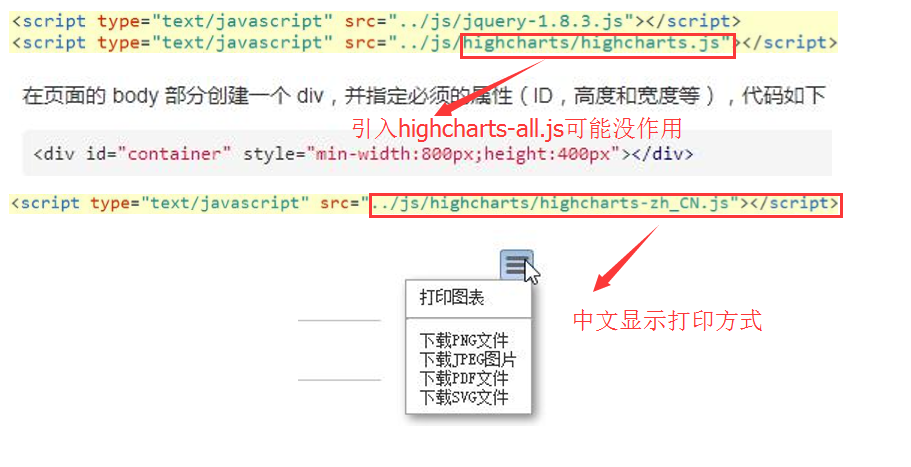
解压文件,在webapp的js下创建和复制highcharts自目录下的js文件
如果原项目有jquery-1.8.3.js删除它里面的jquery.
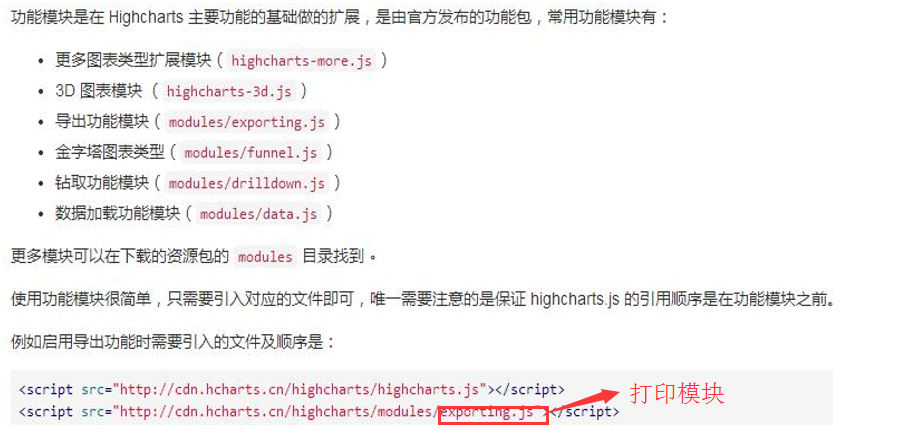
3.引入模块
4.基本知识
5.入门案例


<!DOCTYPE html>
<html>
    <head>
        <meta charset="UTF-8">
        <title>折线图</title>
        <script type="text/javascript" src="js/jquery-1.8.3.js"></script>
        <script type="text/javascript" src="js/highcharts/highcharts.js"></script>
        <script type="text/javascript" src="js/highcharts/modules/exporting.js"></script>
        <script type="text/javascript" src="js/highcharts/highcharts-zh_CN.js"></script>
    </head>
    <script type="text/javascript">
        $(function() {
            $('#container').highcharts({  //调用主函数
                title: {  //主标题
                    text: '各城市各月份温度表',
                    align:'center'  //对齐方式,默认居中对齐
                },
                subtitle: {  //子标题
                    text: '数据来源:中国中央气象局',
                    align:'center'  //对齐方式
                },
                exporting:{
                    enabled:true //是否显示‘打印’,'导出'等功能按钮,默认为显示
                },
                xAxis: {  //x坐标轴
                    categories: ['一月', '二月', '三月', '四月', '五月', '六月',
                        '七月', '八月', '九月', '十月', '十一月', '十二月'
                    ]
                },
                yAxis: {  //y坐标轴
                    title: {
                        text: '温度 (°C)'
                    }/*, 不需要
                    plotLines: [{
                        value: 0,
                        width: 1,
                        color: '#808080'
                    }]*/
                },
                tooltip: {  //数据提示框
                    valueSuffix: '°C'
                },
                legend: {  //图例
                    layout: 'vertical',  //位置,"horizontal" 或 "vertical"
                    align: 'right',  //水平对齐方式
                    verticalAlign: 'middle',  //垂直对齐方式
                    borderWidth: 0  //没有边框
                },
                series: [{  //数据内容
                    name: '郑州',
                    data: [17.0, 6.9, 9.5, 14.5, 18.2, 21.5, 25.2, 26.5, 23.3, 18.3, 13.9, 9.6]
                }, {
                    name: '北京',
                    data: [-0.2, 0.8, 5.7, 11.3, 17.0, 22.0, 24.8, 24.1, 20.1, 14.1, 8.6, 2.5]
                }, {
                    name: '上海',
                    data: [-0.9, 0.6, 3.5, 8.4, 13.5, 17.0, 18.6, 17.9, 14.3, 9.0, 3.9, 1.0]
                }, {
                    name: '广州',
                    data: [3.9, 4.2, 5.7, 8.5, 11.9, 15.2, 17.0, 16.6, 14.2, 10.3, 6.6, 4.8]
                }]
            });
        });
    </script>

    <body>
        <div id="container" style="min-width: 310px; height: 400px; margin: 0 auto"></div>
    </body>

</html>
<!DOCTYPE html>
<html>
    <head>
        <meta charset="UTF-8">
        <title>柱状图</title>
        <script type="text/javascript" src="js/jquery-1.8.3.js"></script>
        <script type="text/javascript" src="js/highcharts/highcharts.js"></script>
        <script type="text/javascript" src="js/highcharts/modules/exporting.js"></script>
        <script type="text/javascript" src="js/highcharts/highcharts-zh_CN.js"></script>
    </head>
    <script type="text/javascript">
        $(function() {
            $('#container').highcharts({  //调用主函数
                chart: { //图表类型
                    type: 'column' //柱状图,默认为折线图
                },
                title: {  //主标题
                    text: '郑州市各月份降雨量',
                    align:'center'  //对齐方式,默认居中对齐
                },
                subtitle: {  //子标题
                    text: '数据来源:中国中央气象局',
                    align:'center'  //对齐方式
                },
                xAxis: { //x坐标轴
                    categories: ['一月', '二月', '三月', '四月', '五月', '六月',
                        '七月', '八月', '九月', '十月', '十一月', '十二月'
                    ]
                },
                yAxis: { //y坐标
                    title: {
                        text: '降雨量(mm)'
                    }
                },
                tooltip: { //数据提示框
                    valueSuffix: 'mm'
                },
                series: [ {  //数据内容
                    name: '郑州',
                    data: [42.4, 33.2, 34.5, 39.7, 52.6, 75.5, 57.4, 60.4, 47.6, 39.1, 46.8, 51.1]
                }]
            });
        });
    </script>

    <body>
        <div id="container" style="min-width: 310px; height: 400px; margin: 0 auto"></div>
    </body>

</html>
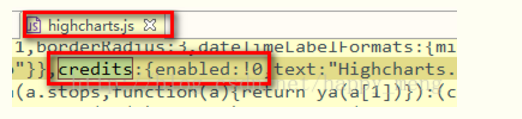
6.常见问题解决
6.1去除图表右下角的logo
在higcharts.js中找到版权标签,把enabled属性的!0替换为0即可。
7.查询数据库生成报表
效果图:
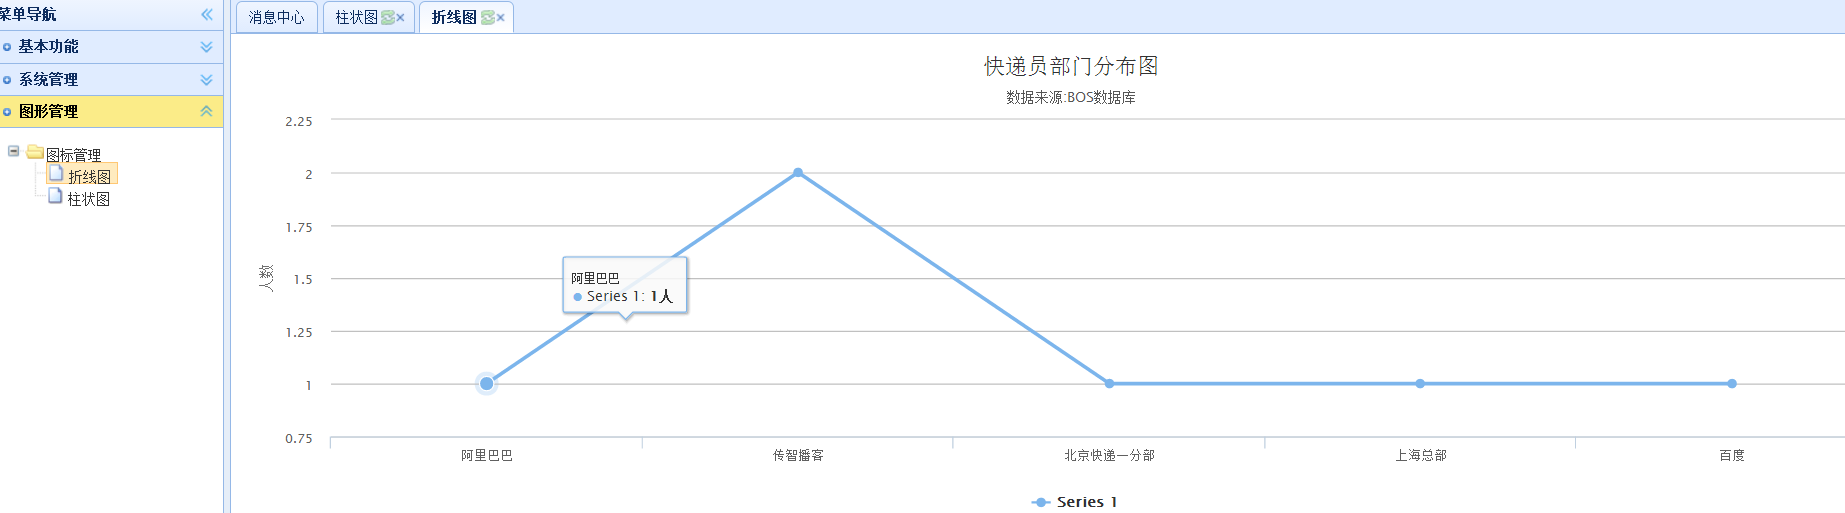
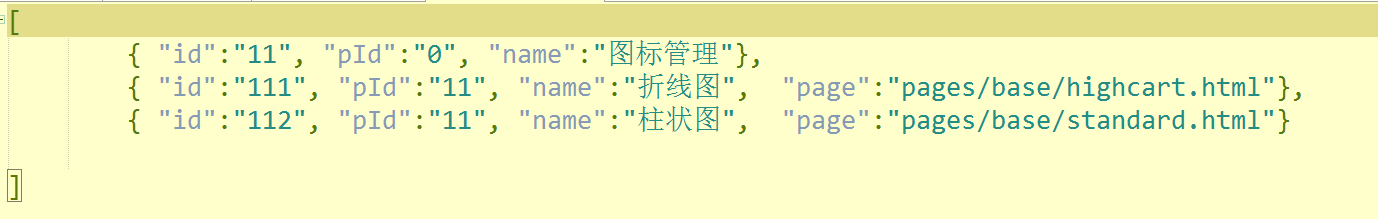
因为界面采用easyui+zTree,所以先从index.html跳转到一个json上,json仔跳转到一个thml页面上,然后发送异步请求,获取数据
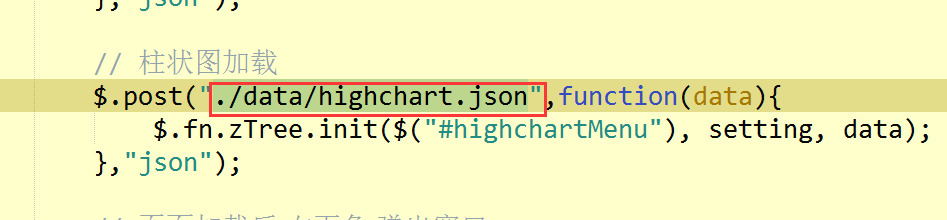
highchart.json界面
<!DOCTYPE html>
<html>
    <head>
        <meta charset="UTF-8">
        <title>折线图</title>
        <script type="text/javascript" src="../../js/jquery-1.8.3.js"></script>
        <script type="text/javascript" src="../../js/highcharts/highcharts.js"></script>
        <script type="text/javascript" src="../../js/highcharts/modules/exporting.js"></script>
        <script type="text/javascript" src="../../js/highcharts/highcharts-zh_CN.js"></script>
    </head>
    <script type="text/javascript">
        $(function() {
           $.post("../../highchart_show.action",function(data){
                    $('#container').highcharts({  //调用主函数
                    title: {  //主标题
                        text: '快递员部门分布图',
                        align:'center'  //对齐方式,默认居中对齐
                    },
                    subtitle: {  //子标题
                        text: '数据来源:BOS数据库',
                        align:'center'  //对齐方式
                    },
                    exporting:{
                        enabled:true //是否显示‘打印’,'导出'等功能按钮,默认为显示
                    },
                    xAxis: {  //x坐标轴
                        categories:data.categories
                    },
                    yAxis: {  //y坐标轴
                        title: {
                            text: '人数'
                        }
                    },
                    tooltip: {  //数据提示框
                        valueSuffix: '人'
                    },
                    series:[{

                        data:data.series
                    }]
                });

            },"json");
        });
    </script>

    <body>
        <div id="container" style="min-width: 310px; height: 400px; margin: 0 auto"></div>
    </body>

</html>
package cn.itcast.bos.web.action.highchart;

import java.util.ArrayList;
import java.util.HashMap;
import java.util.List;
import java.util.Map;

import org.apache.struts2.convention.annotation.Action;
import org.apache.struts2.convention.annotation.Namespace;
import org.apache.struts2.convention.annotation.ParentPackage;
import org.apache.struts2.convention.annotation.Result;
import org.springframework.beans.factory.annotation.Autowired;
import org.springframework.context.annotation.Scope;
import org.springframework.stereotype.Controller;

import com.opensymphony.xwork2.ActionContext;
import com.opensymphony.xwork2.ActionSupport;

import cn.itcast.bos.service.base.CourierService;

@Controller
@Scope("prototype")
@Namespace("/")
@ParentPackage("json-default")
public class HighchartAction extends ActionSupport{

    @Autowired
    private CourierService courierService;

    @Action(value="highchart_show",results={@Result(name="success",type="json")})
    public String highchartShow(){
        List<Object[]> list =  courierService.highchartShow();

        List<String> categories = new ArrayList<>();
        List<Long> series = new ArrayList<>();

        for (Object[] object : list) {
            categories.add((String) object[0]);
            series.add( (Long) object[1]);
        }

        Map<String, Object> map = new HashMap<>();
        map.put("categories", categories);
        map.put("series", series);
        System.out.println(map);
        ActionContext.getContext().getValueStack().push(map);
        return SUCCESS;
    }
}
service层代码
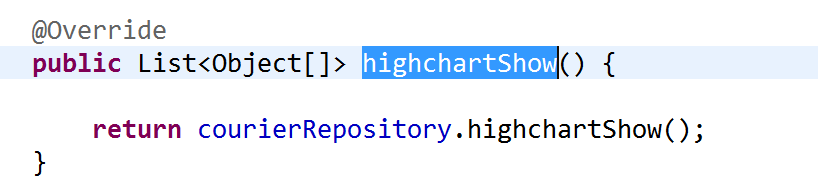
dao层代码


 浙公网安备 33010602011771号