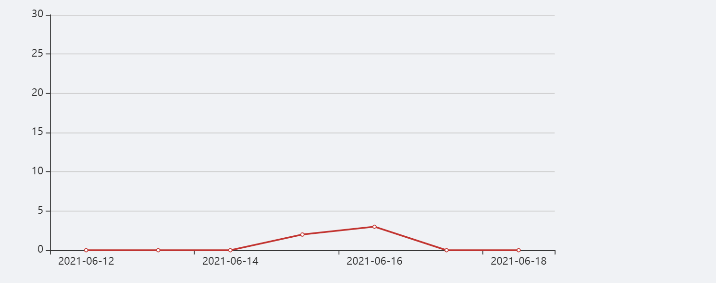
echarts Y轴设置刻度间隔 和 饼图 数据为空问题

  yAxis: {
          type: "value",
          max: 30,
          min:0,
          minInterval: 5,
          interval: 5//刻度增加几个
        },
基本配置
html

<div id="classAll" :style="{ width: '500px', height: '300px' }"></div>
和数据配置

 classAll: {
        title: {
          // text: "班级总数",
          // subtext: '纯属虚构',
          show: null,
          text: "暂无数据",
          left: "center",
          top:"80",
          textStyle: {
            fontSize: 25,
            fontWeight: 400,
          },
        },
        tooltip: {
          trigger: "item",
          formatter: "", //这是关键,在需要的地方加上就行了
          // formatter: "{a} <br/>{b} : {c} ({d}%)",
        },
        legend: {
          orient: "vertical",
          top: "top",
          bottom: 10,
          right: 20,
          data: null,//数据为空时 侧边栏 文字也不现实
        },
        series: [
          {
            name: "班级总数",
            type: "pie",
            radius: "80%",
            center: ["30%", "50%"], //显示位置
            label: {
              //饼图图形上的文本标签
              normal: {
                show: true,
                position: "inner", //标签的位置
                textStyle: {
                  fontWeight: 300,
                  fontSize: 16, //文字的字体大小
                },
                formatter: function (e) {
                  let data = e.data;
                  if (data.value == 0) {
                    // data.labelLine.show = false;
                    // data.label.show = false;
                    return "";
                  } else {
                    // return `${data.value}\n${e.percent}%`;
                    return `${e.percent}%`;
                  }
                },
              },
            },
            data: [],
            emphasis: {
              itemStyle: {
                shadowBlur: 10,
                shadowOffsetX: 0,
                shadowColor: "rgba(0, 0, 0, 0.5)",
              },
            },
          },
          // percent: number,
        ],
      },
画图封装方法

drawLine(dom) {
      let domId = document.getElementById(dom);
      // 基于准备好的dom,初始化echarts实例
      let myChart = this.$echarts.init(domId);
      // 绘制图表
      myChart.setOption(this[dom]);
    },
请求后台拿数据渲染 数据为空显示暂时无数据

 getSchoolAllData(this.region, this.groupType).then((res) => {
        console.log(res);
        this.schoolSum = res.data.data.schoolSum;
        this.studentSum = res.data.data.studentSum;
        this.teacherSum = res.data.data.teacherSum;
        this.teamSum = res.data.data.teamSum;
        let province = res.data.data.province;
        let city = res.data.data.city;
        let region = res.data.data.region;

        if (region != undefined && region != "" && region != null) {
          this.selectedOptions = [];
          this.selectedOptions.push(province);
          this.selectedOptions.push(city);
          this.selectedOptions.push(region);
          this.region = region;

          this.disabled = true;
        }

        let list = res.data.data.list;
        this.tableData = list;

        let data = [];
        list.forEach(function (ele) {
          let value = { value: ele.teamNumber, name: ele.name };
          data.push(value);
        });

        let showed = data.length ? false : true;
        this.classAll.title.show = showed;
        this.classAll.series[0].data = data;
        this.classAll.legend.data = data.length ? null : "false";
        this.drawLine("classAll");
}


【推荐】编程新体验,更懂你的AI,立即体验豆包MarsCode编程助手
【推荐】凌霞软件回馈社区,博客园 & 1Panel & Halo 联合会员上线
【推荐】抖音旗下AI助手豆包,你的智能百科全书,全免费不限次数
【推荐】轻量又高性能的 SSH 工具 IShell:AI 加持,快人一步