
python制作叠起来的柱状图,并且加上error bar
matplotlib.pyplot.bar 可以画柱状图,其中的关键字参数 yerr 可以添加 error bar, 关键字参数 bottom 可以摞起来。
以下代码据说源自官网,我是从这里拷贝:https://blog.csdn.net/qq_42935317/article/details/115672473
# a stacked bar plot with errorbars
import numpy as np
import matplotlib.pyplot as plt
N = 5
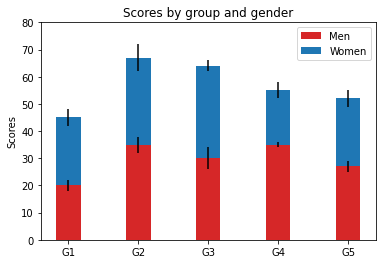
menMeans = (20, 35, 30, 35, 27)
womenMeans = (25, 32, 34, 20, 25)
menStd = (2, 3, 4, 1, 2)
womenStd = (3, 5, 2, 3, 3)
ind = np.arange(N) # the x locations for the groups
width = 0.35 # the width of the bars: can also be len(x) sequence
p1 = plt.bar(ind, menMeans, width, color='#d62728', yerr=menStd)
p2 = plt.bar(ind, womenMeans, width,
bottom=menMeans, yerr=womenStd)
plt.ylabel('Scores')
plt.title('Scores by group and gender')
plt.xticks(ind, ('G1', 'G2', 'G3', 'G4', 'G5'))
plt.yticks(np.arange(0, 81, 10))
plt.legend((p1[0], p2[0]), ('Men', 'Women'))
plt.show()


 浙公网安备 33010602011771号