LTspice 修改波形图与电路图配色
前言
LTspice的默认颜色设置看起来比较偏暗,且不太适合截图使用,如下所示:
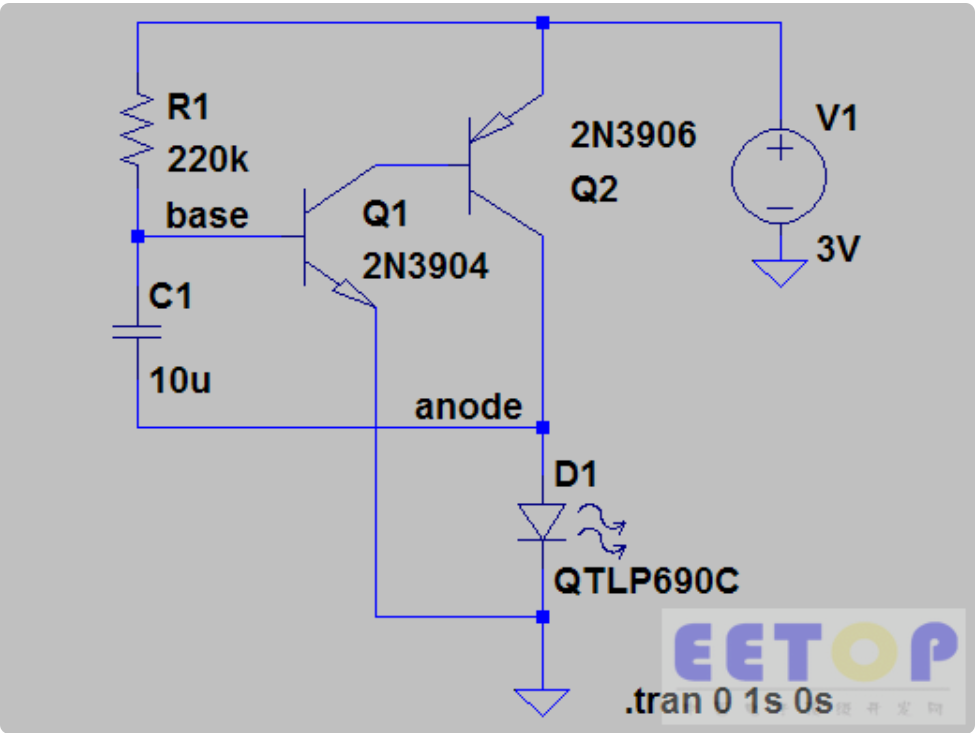
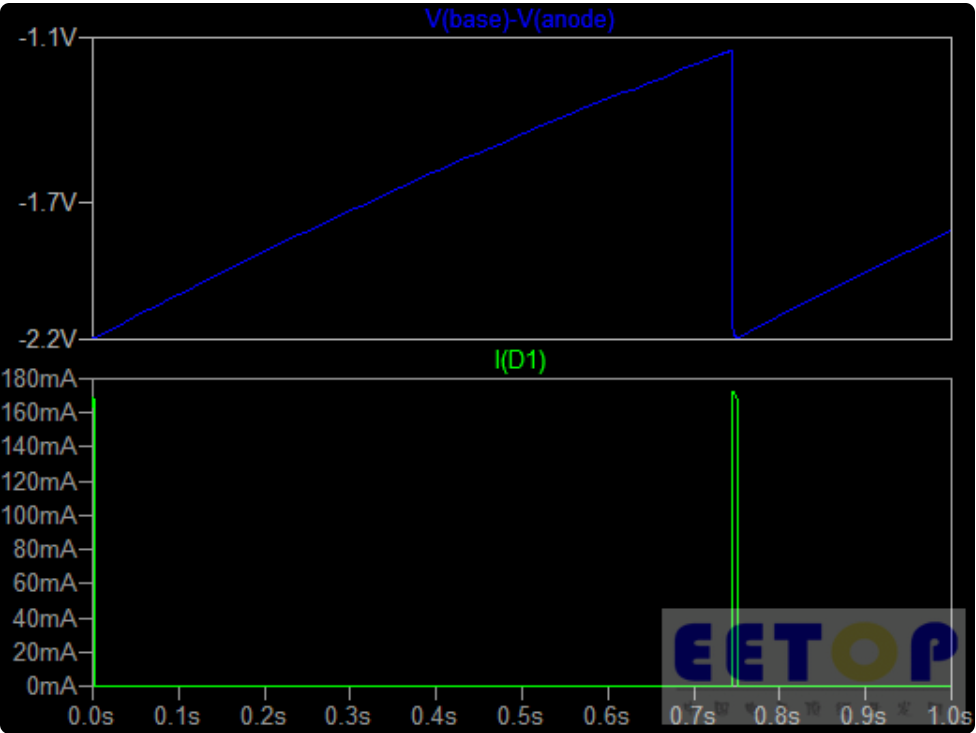
本文介绍通过修改默认颜色设置来实现电路图颜色和BSch3V,波形图和gnuplot的配色相似。
LTspice的颜色设置可以通过[Tools] -> [Color Preferences]来进行。
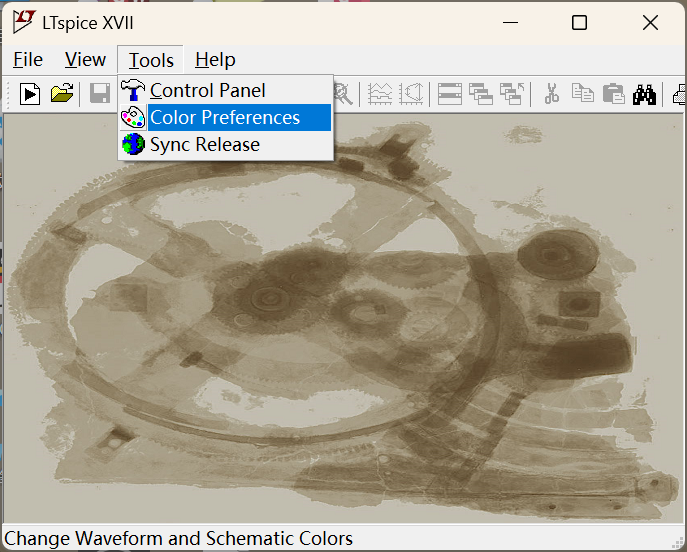
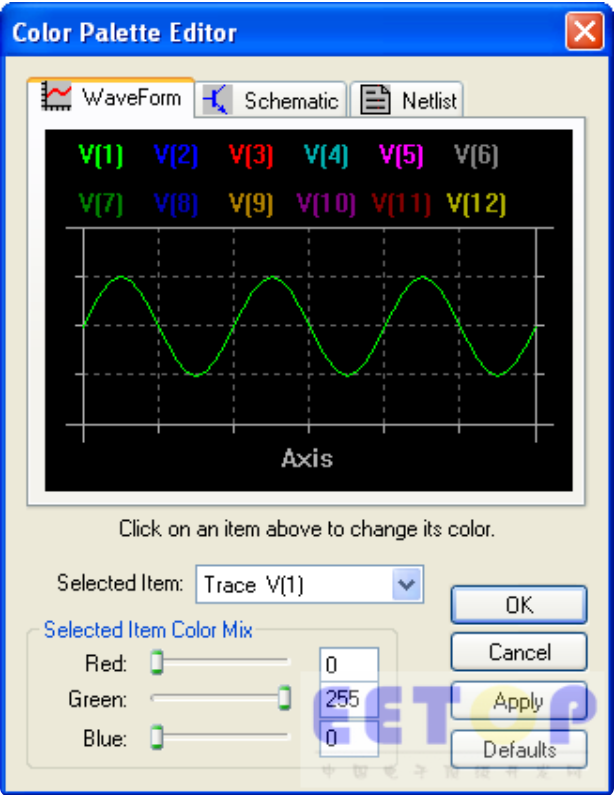
波形图配色设置
波形显示的颜色设置通过上图Color Palette Editor中WaveForm->Select Item来一一选择并改变配色来进行。
推荐的波形图颜色设置如下:
| Item | Red | Green | Blue |
|---|---|---|---|
| Trace V(1) | 255 | 0 | 0 |
| Trace V(2) | 0 | 192 | 0 |
| Trace V(3) | 0 | 128 | 255 |
| Trace V(4) | 192 | 0 | 255 |
| Trace V(5) | 0 | 238 | 238 |
| Trace V(6) | 192 | 64 | 0 |
| Trace V(7) | 238 | 238 | 0 |
| Trace V(8) | 32 | 32 | 192 |
| Trace V(9) | 255 | 192 | 32 |
| Trace V(10) | 0 | 128 | 64 |
| Trace V(11) | 160 | 128 | 225 |
| Trace V(12) | 128 | 64 | 0 |
| Axis | 0 | 0 | 0 |
| Inactive Axis | 0 | 0 | 0 |
| Grid | 100 | 100 | 100 |
| Background | 255 | 255 | 255 |
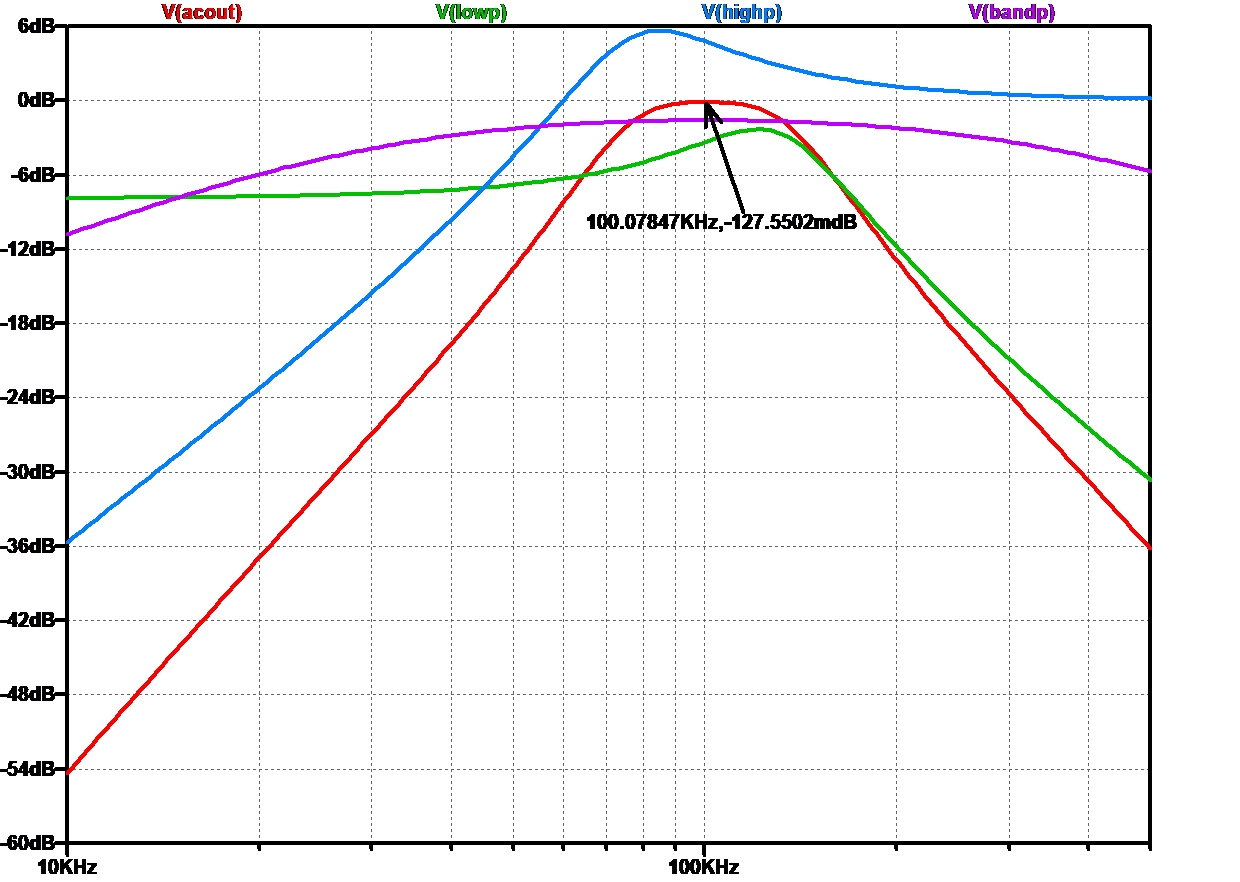
更改配色方案之后的显示效果图:
电路图配色设置
电路图的颜色设置通过Color Palette Editor中Schematic->Select Item来一一选择并改变配色来进行。
推荐的电路图颜色设置如下:
| Item | Red | Green | Blue |
|---|---|---|---|
| Wires | 0 | 125 | 0 |
| Junctions | 0 | 125 | 0 |
| Componet body | 192 | 0 | 0 |
| Graphc Flag | 192 | 0 | 0 |
| Comment Fill-in | 255 | 255 | 192 |
| Component Text | 0 | 0 | 0 |
| Flag Text | 0 | 0 | 0 |
| SPICE Directive Text | 0 | 0 | 0 |
| Comment Text | 0 | 0 | 192 |
| Unconnected Pin | 0 | 125 | 0 |
| Highlight Color | 255 | 0 | 0 |
| Grid | 192 | 0 | 0 |
| Background | 255 | 255 | 255 |
更改配色方案之后的显示效果图:

波形显示格式设置
另外,如果觉得波形显示时坐标的字体太小,可以通过[Tools]->[Control Panel]打开[Control Panel]设置对话框,在其中的[Waveforms]页面中[Font]不要用[System],而是选[Arial]后就可以设置[Font]大小,推荐使用13号字体。
最终的波形图显示效果:


 浙公网安备 33010602011771号