[数据分析与可视化] 数据绘图要点10-图例的构建
数据绘图要点10-图例的构建
图例是数据可视化中传达信息非常关键的部分,因此创建合适的图例非常重要。这篇文章描述了如何设置ggplot2图例中的标题、文本、位置、符号等。
ggplot2图例设置
ggplot2创建默认图例
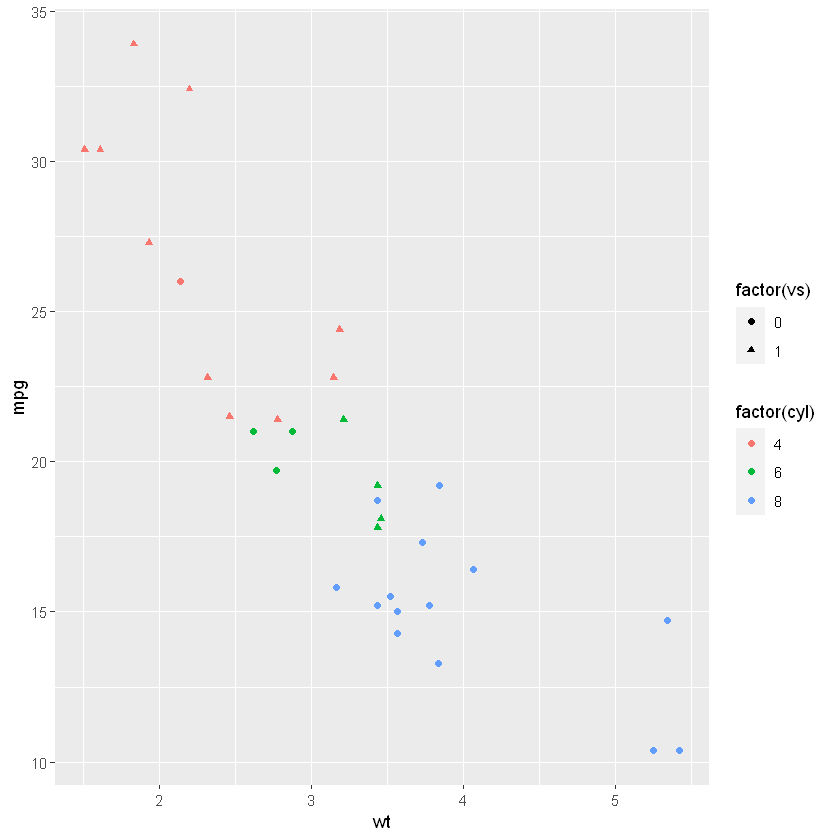
默认情况下,只要形状特征映射到ggplot调用的aes()部分中的变量,ggplot2就会自动在图表上生成图例。因此,如果您在ggplot2中设置颜色、形状或透明度,则会默认创建图例。如果你想查看ggplot2可以设置的信息,调用ggplot2::theme即可。
# 加载ggplot2
library(ggplot2)
# 展示自带的mtcars数据
head(mtcars)
| mpg | cyl | disp | hp | drat | wt | qsec | vs | am | gear | carb | |
|---|---|---|---|---|---|---|---|---|---|---|---|
| <dbl> | <dbl> | <dbl> | <dbl> | <dbl> | <dbl> | <dbl> | <dbl> | <dbl> | <dbl> | <dbl> | |
| Mazda RX4 | 21.0 | 6 | 160 | 110 | 3.90 | 2.620 | 16.46 | 0 | 1 | 4 | 4 |
| Mazda RX4 Wag | 21.0 | 6 | 160 | 110 | 3.90 | 2.875 | 17.02 | 0 | 1 | 4 | 4 |
| Datsun 710 | 22.8 | 4 | 108 | 93 | 3.85 | 2.320 | 18.61 | 1 | 1 | 4 | 1 |
| Hornet 4 Drive | 21.4 | 6 | 258 | 110 | 3.08 | 3.215 | 19.44 | 1 | 0 | 3 | 1 |
| Hornet Sportabout | 18.7 | 8 | 360 | 175 | 3.15 | 3.440 | 17.02 | 0 | 0 | 3 | 2 |
| Valiant | 18.1 | 6 | 225 | 105 | 2.76 | 3.460 | 20.22 | 1 | 0 | 3 | 1 |
# 绘图
# 横轴wt,纵轴mpg,颜色cyl,形状factor
basic <- ggplot(mtcars, aes(wt, mpg, colour = factor(cyl), shape = factor(vs) )) +
       geom_point()
basic
更改图例标题labs()
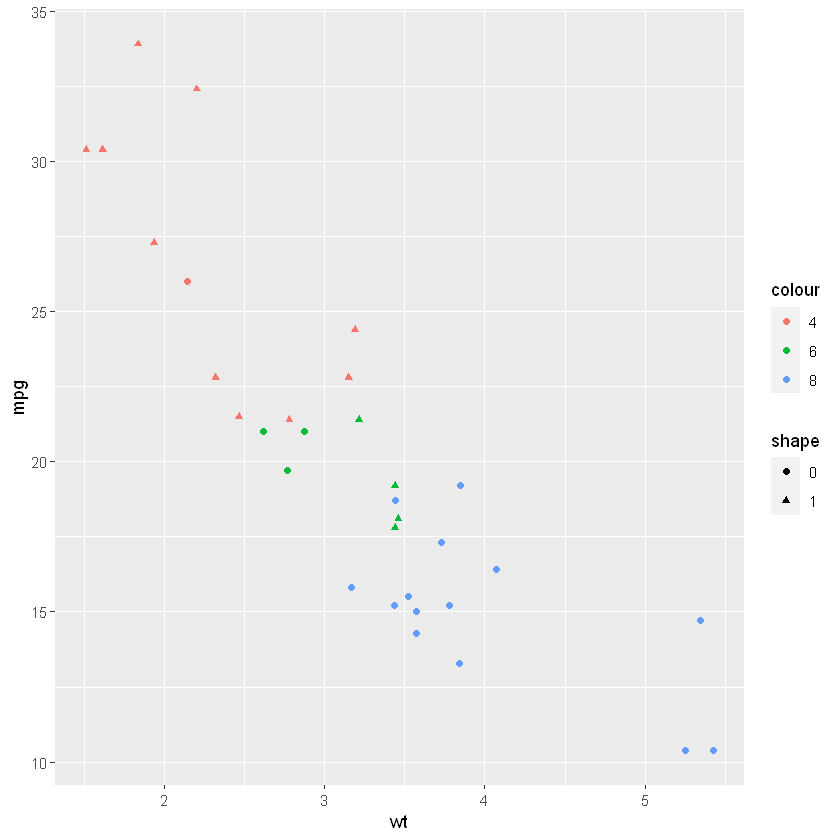
labs()函数允许更改图例标题。您可以为图例的每个部分指定一个标题,即图表中使用的每个美学aesthetics 。
# 在默认图表的基础上设置图例标题
basic+
  labs(
         colour = "colour",
         shape = "shape"
        )
图例信息的删除
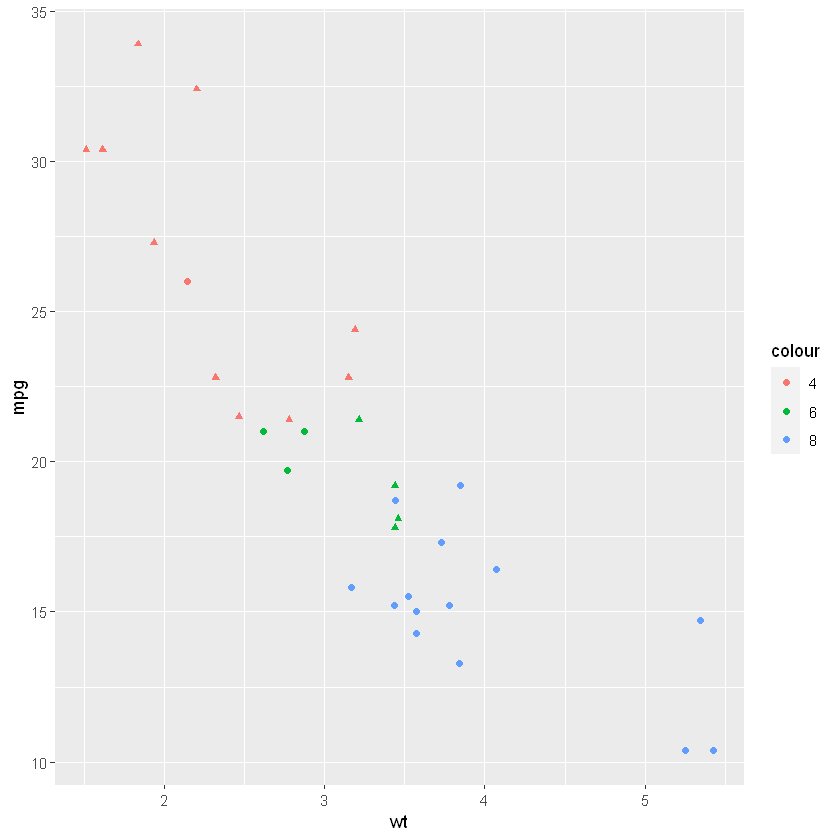
通过theme()和guides()可以删除整个图例或图例的特定部分。
# 删除shape
basic + guides(shape=FALSE) +
labs(
     colour = "colour",
     shape = "shape"
    )
Warning message:
"`guides(<scale> = FALSE)` is deprecated. Please use `guides(<scale> = "none")` instead."
# 删除图例
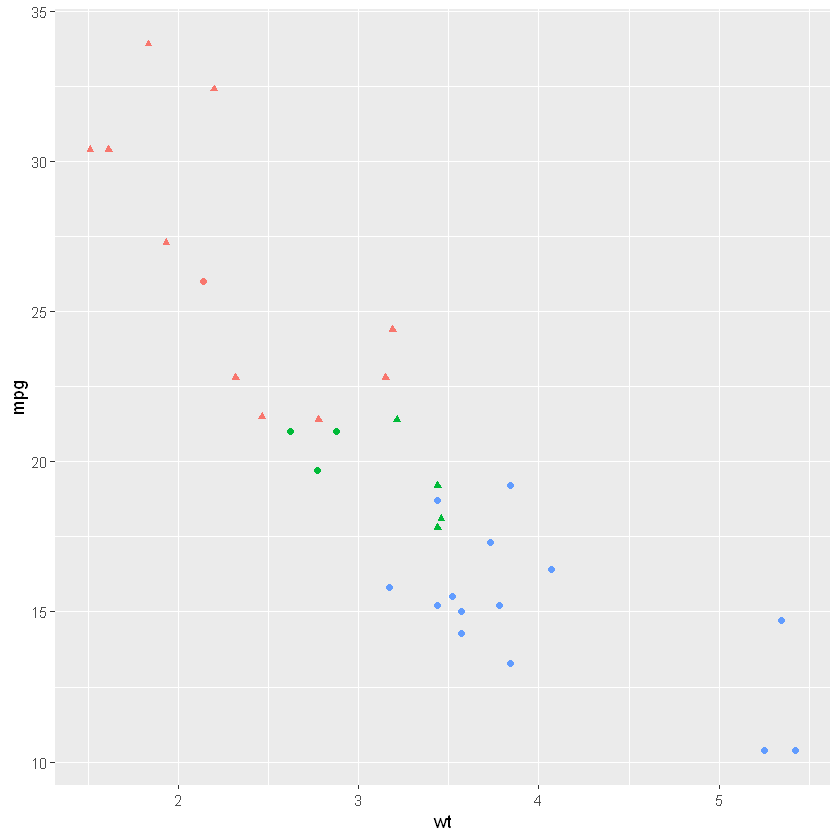
basic + theme(legend.position = "none")
控制图例位置
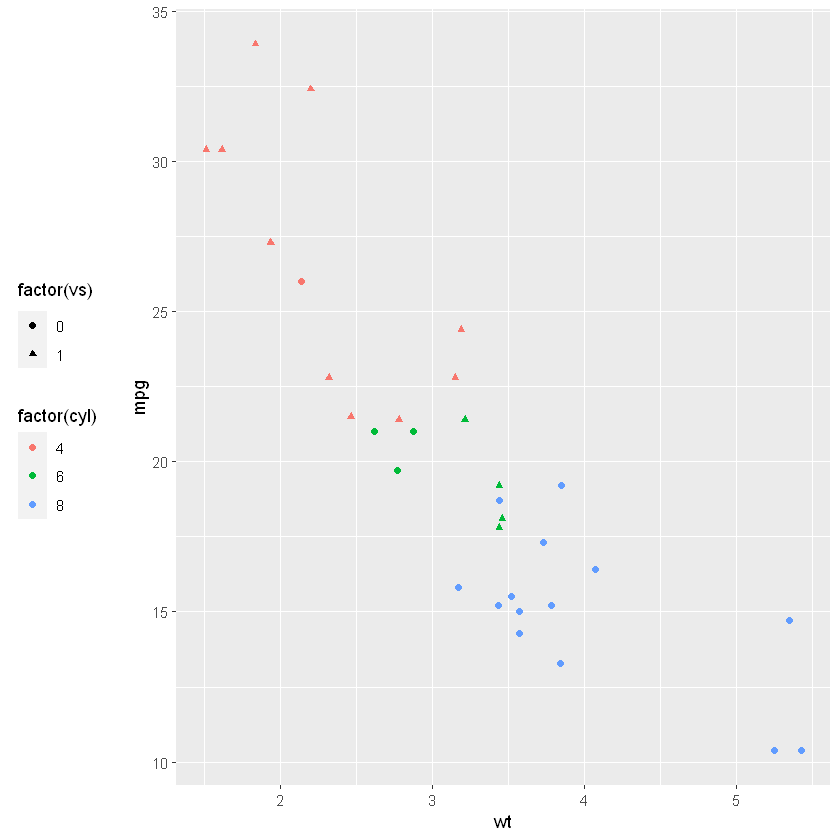
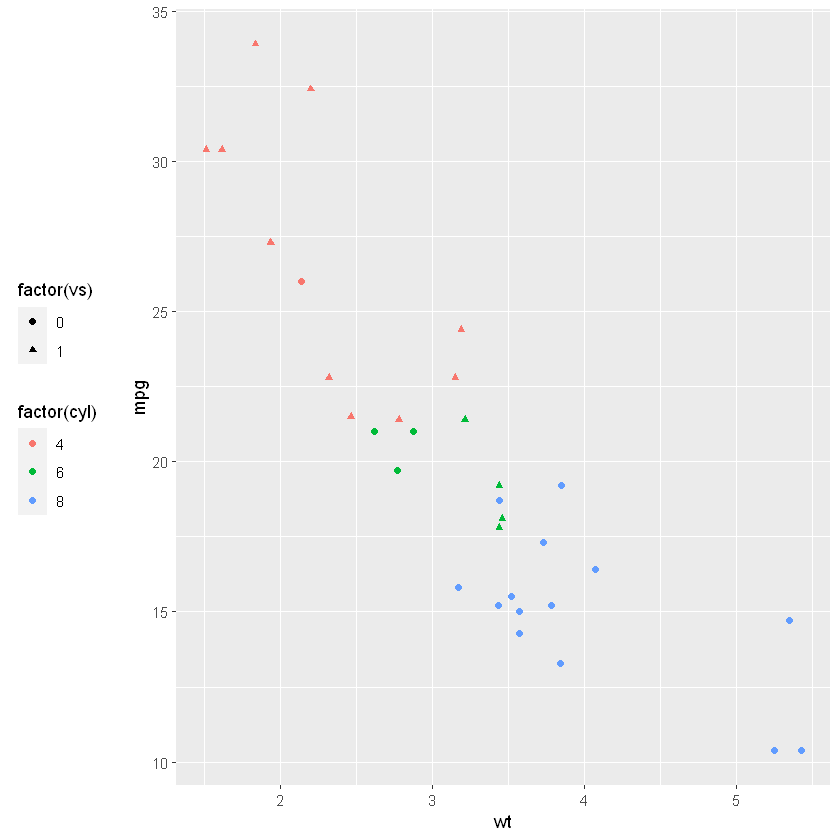
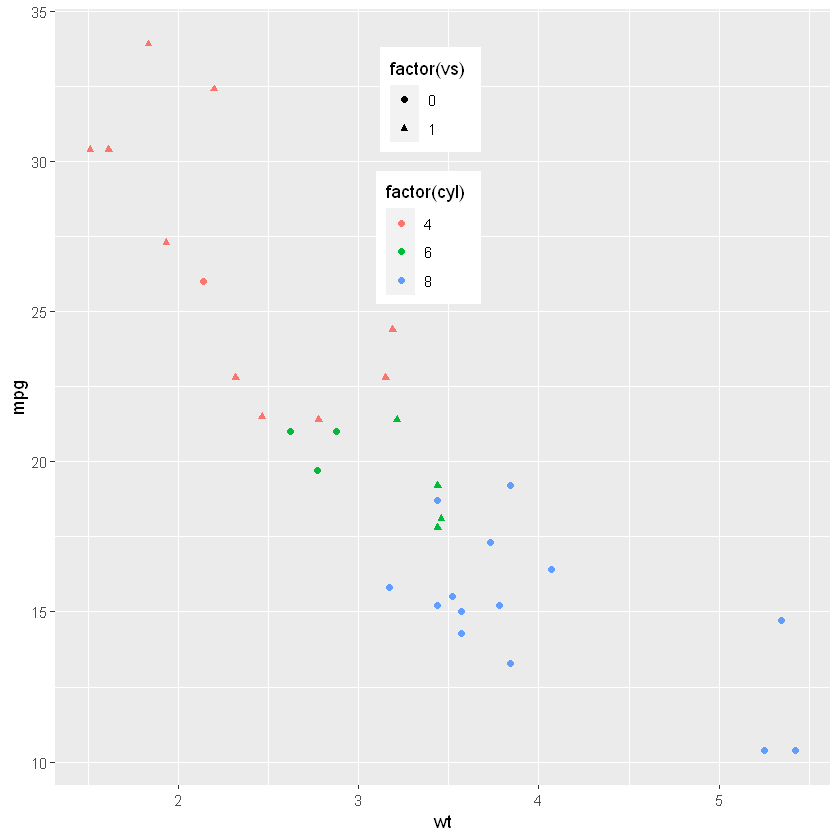
ggplot2允许将图例放在任何地方。如果将图例放在图表周围,使用legend.position选项并指定top,right,bottom,或left。要将图例放在绘图区域内,指定一个长度为2的向量,两个值都在 0 和 1 之间,并给出x和y坐标即可。
# 将图例放在图表左边
basic + theme(legend.position = "left")
# 将图例放在图表左边
# legend.justification设置图例位置后,图例具体所处方位
basic + theme(legend.position = "left",legend.justification = c("left", "center"))
basic + theme(
    legend.position = c(0.55, 0.95), # 设置图例起始位置,左下角为原点,横坐标和纵坐标范围都为0到1
    legend.justification = c("right", "top"), #设置图例位置后,图例具体所处方位
    legend.box.just = "right", # 设置不同图例对齐方式
    legend.margin = margin(6, 6, 6, 6) # 设置图例内容外边距
    )
图例外观设置
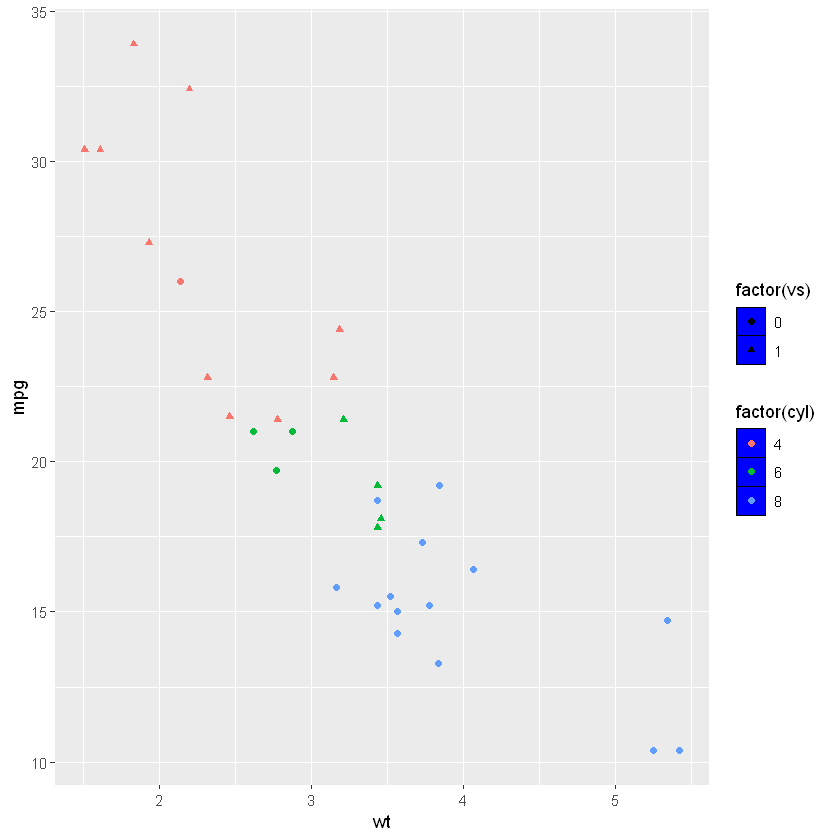
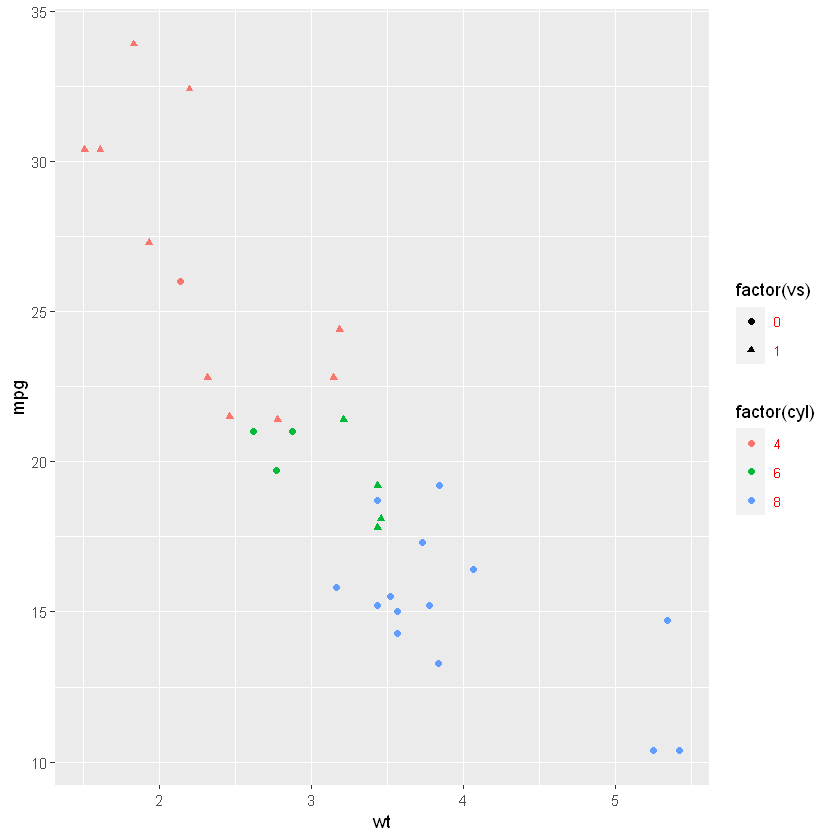
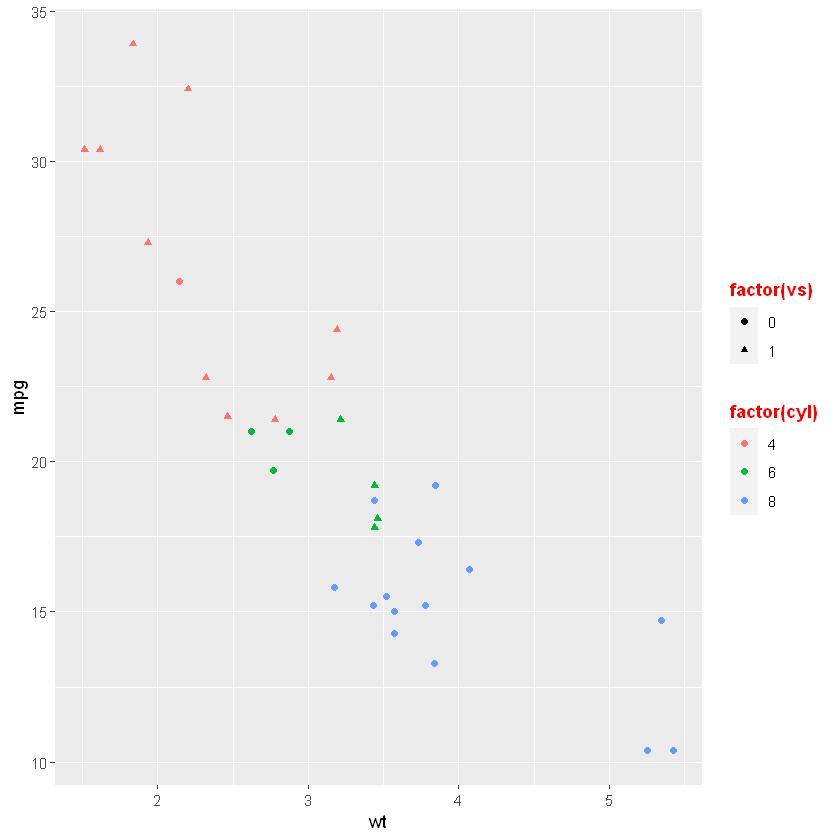
以下是 4 个示例,展示了如何自定义图例的主要功能:
- legend.box 自定义图例外框
- legend.key 设置图例中每一个变量key值的展示信息
- legend.text 设置图例字体
- legend.title 设置图例标题
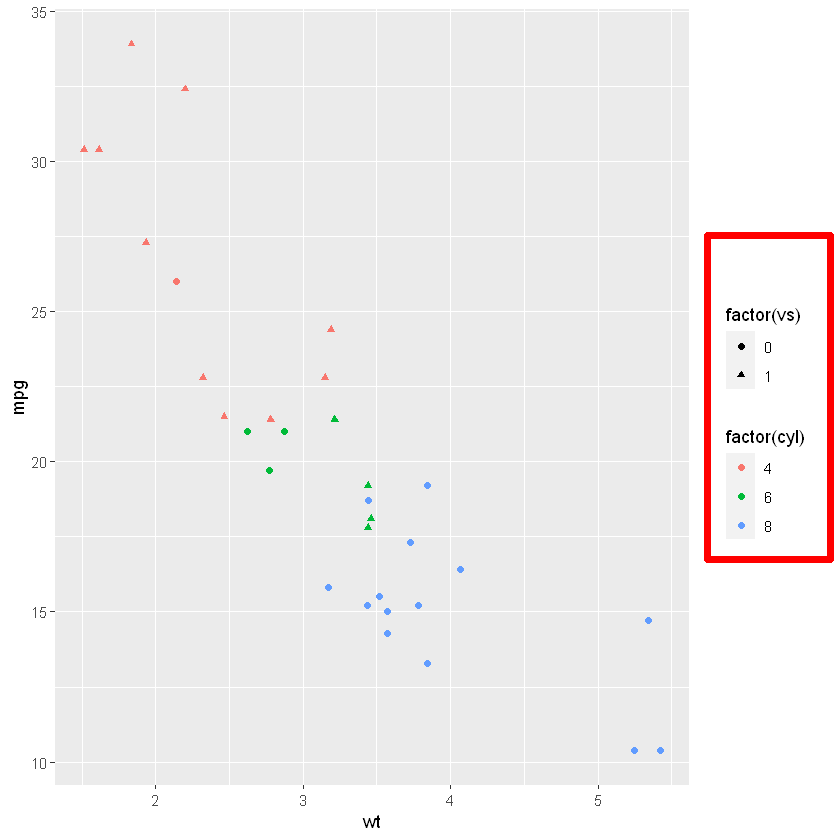
# 自定义图例外框
basic + theme(
    # 设置外框颜色
    legend.box.background = element_rect(color="red", size=2),
    # 设置外框边距
    legend.box.margin = margin(36, 6, 6, 6)
)
# 设置图例中每一个变量key值的展示信息
basic + theme(legend.key = element_rect(fill = "blue", colour = "black"))
# 自定义图例字体颜色
basic + theme(legend.text = element_text(size = 8, colour = "red"))
# 设置图例标题
basic + theme(legend.title = element_text(face = "bold",colour = 'red'))
参考
本文来自博客园,作者:落痕的寒假,转载请注明原文链接:https://www.cnblogs.com/luohenyueji/p/16970182.html


